NOT LISTED FOR SALE

664 Red Oak Ln Hinesville, GA 31313

Estimated Value: $320,404 - $361,000

4 Beds
3 Baths
2,720 Sq Ft
$128/Sq Ft Est. Value

Last Sold July 02, 2018

Last sale price $229,995 $85 Per Sq Ft

Est. 52% increase in value since last sale

Current estimated payment $2,272/month

About This Home

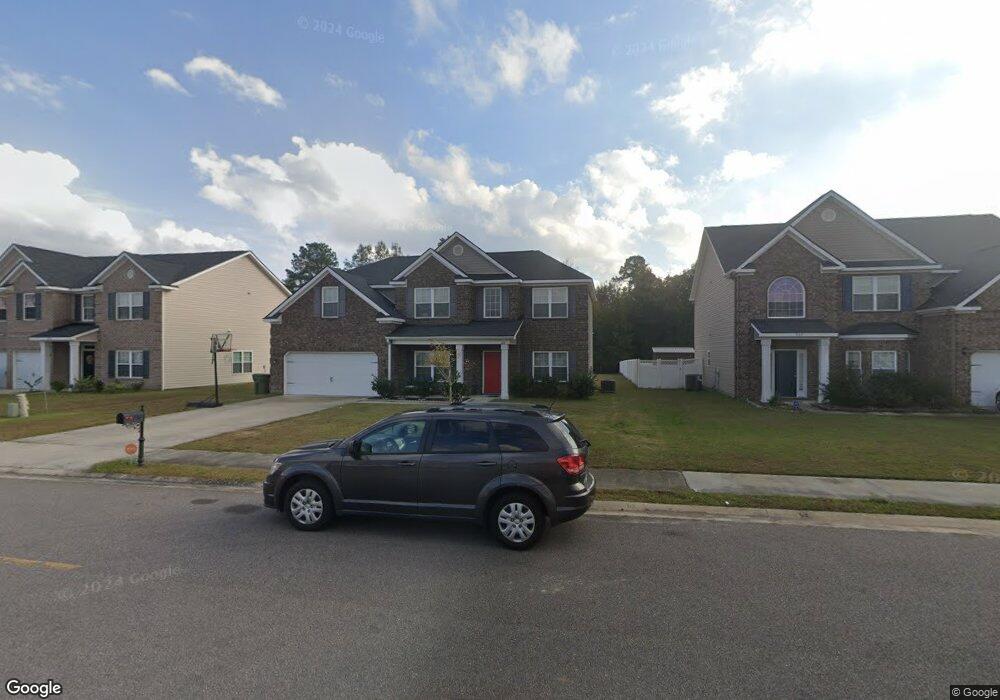
The Richland floor plan from RTS Homes' covenant series features a formal living and dining rooms, family room, mudroom, kitchen with breakfast area, powder room downstairs, all bedrooms and 2 full bathrooms upstairs. The spacious kitchen will feature an island, granite counter tops, tile backsplash and stainless appliances including refrigerator. Large master suite features a sitting area, separate vanities AND separate walk-in closets! This home is sure to meet all your wants!

Ownership History

Date Name Owned For Owner Type

Purchase Details

Closed on
Jul 2, 2018
Sold by
Rts Homes Llc
Bought by
Samuel Sharon C and Zephyrinua Samuel James
Current Estimated Value
$349,101

Home Financials for this Owner

Home Financials are based on the most recent Mortgage that was taken out on this home.
Original Mortgage
$225,829
Outstanding Balance
$197,294
Interest Rate
4.87%
Mortgage Type
FHA
Estimated Equity
$151,807

Purchase Details

Closed on
Sep 6, 2017
Sold by
T
Bought by
Rts Homes Llc
Source: Public Records

Range of Values:

--
Value Increase
--
Percent Increase
--
Adjusted for Inflation
Collateral Analytics

Collateral Analytics Collateral Analytics AVMs (Automated Valuation Model) employ a number of statistical approaches combined with neighborhood-specific comparable selection guarantees the most up-to-date and precise valuations.

Not Available

Collateral Analytics does not have data for the current month. Please view the chart for historical values.

ICE

ICE Mortgage Technology ICE Mortgage Technology’s AVM (Automated Valuation Model) is a state-of-the-art online residential property valuation tool that provides a quick and accurate estimate of the value of almost any home in the U.S.

Not Available

ICE Mortgage Technology does not have data for the current month. Please view the chart for historical values.

First American

First American First American Data & Analytics’ next-generation AVM combines unrivaled data assets with a blended ensemble of valuation models to produce highly accurate, reliable valuations you can trust.

Not Available

First American does not have data for the current month. Please view the chart for historical values.

Quantarium

Quantarium Quantarium’s valuation service, repeatedly proven the industry’s most accurate and comprehensive, is supercharged with a self-learning and auto-tuning AI engine that continually becomes smarter and more accurate as it processes daily inputs from the industry’s leading RE data lake.

Not Available

Quantarium does not have data for the current month. Please view the chart for historical values.

Average Value
Not Available
List Price
Sold Price
Create a Home Valuation Report for This Property
The Home Valuation Report is an in-depth analysis detailing your home's value as well as a comparison with similar homes in the area

Home Values in the Area

Source: Public Records

Average Home Value in this Area


Source: Public Records

Purchase History

Date Buyer Sale Price Title Company
Samuel Sharon C $229,995 --
Rts Homes Llc $212,000 --
Source: Public Records

Mortgage History

Date Status Borrower Loan Amount
Open Samuel Sharon C $225,829
Source: Public Records

Property History

Date Event Price List to Sale Price per Sq Ft Prior Sale
07/02/2018 07/02/18 Sold $229,995 0.0% $85 / Sq Ft View Prior Sale
05/17/2018 05/17/18 Pending -- -- --
12/22/2017 12/22/17 For Sale $229,995 -- $85 / Sq Ft

Tax History Compared to Growth

Source: Public Records

Tax History

Year Tax Paid Tax Assessment Tax Assessment Total Assessment is a certain percentage of the fair market value that is determined by local assessors to be the total taxable value of land and additions on the property. Land Improvement
2024 $4,928 $130,880 $19,200 $111,680
2023 $4,928 $117,614 $19,200 $98,414
2022 $4,196 $102,204 $19,200 $83,004
2021 $4,081 $93,197 $19,200 $73,997
2020 $3,849 $84,473 $14,000 $70,473
2019 $3,820 $84,473 $14,000 $70,473
2018 $2,097 $44,271 $14,000 $30,271
2017 $231 $7,000 $7,000 $0
2016 $313 $7,000 $7,000 $0
Source: Public Records

Agents Affiliated with this Home

  • Section Image
  • Section Image
  • Section Image
See All Agents

Map