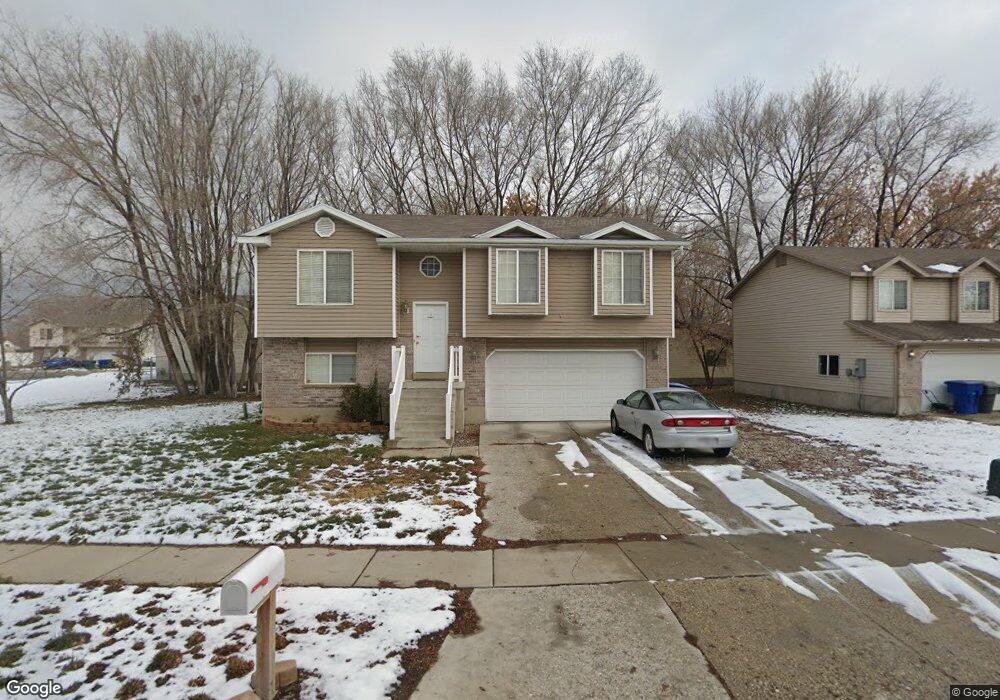
664 S 375 W Ogden, UT 84404
Lynn NeighborhoodEstimated Value: $373,000 - $410,000
3
Beds
2
Baths
1,458
Sq Ft
$268/Sq Ft
Est. Value
About This Home
This home is located at 664 S 375 W, Ogden, UT 84404 and is currently estimated at $391,317, approximately $268 per square foot. 664 S 375 W is a home located in Weber County with nearby schools including Heritage Elementary School, Highland Junior High School, and Ben Lomond High School.
Ownership History
Date
Name
Owned For
Owner Type
Purchase Details
Closed on
Sep 10, 2008
Sold by
Paben Jamie Lee
Bought by
Mas Cesar Augusto
Current Estimated Value
Home Financials for this Owner
Home Financials are based on the most recent Mortgage that was taken out on this home.
Original Mortgage
$158,536
Outstanding Balance
$105,348
Interest Rate
6.5%
Mortgage Type
VA
Estimated Equity
$285,969
Purchase Details
Closed on
May 5, 2006
Sold by
Green Daniel K
Bought by
Paben Jamie Lee
Home Financials for this Owner
Home Financials are based on the most recent Mortgage that was taken out on this home.
Original Mortgage
$108,720
Interest Rate
7.27%
Mortgage Type
Fannie Mae Freddie Mac
Purchase Details
Closed on
Jan 25, 2006
Sold by
Aldrich Kasey J
Bought by
Green Daniel K
Create a Home Valuation Report for This Property
The Home Valuation Report is an in-depth analysis detailing your home's value as well as a comparison with similar homes in the area
Home Values in the Area
Average Home Value in this Area
Purchase History
| Date | Buyer | Sale Price | Title Company |
|---|---|---|---|
| Mas Cesar Augusto | -- | Bonneville Superior Title Co | |
| Paben Jamie Lee | -- | Mountain View Title | |
| Green Daniel K | $105,756 | None Available |
Source: Public Records
Mortgage History
| Date | Status | Borrower | Loan Amount |
|---|---|---|---|
| Open | Mas Cesar Augusto | $158,536 | |
| Previous Owner | Paben Jamie Lee | $108,720 |
Source: Public Records
Tax History
| Year | Tax Paid | Tax Assessment Tax Assessment Total Assessment is a certain percentage of the fair market value that is determined by local assessors to be the total taxable value of land and additions on the property. | Land | Improvement |
|---|---|---|---|---|
| 2025 | $2,331 | $341,712 | $135,120 | $206,592 |
| 2024 | $2,369 | $341,000 | $135,127 | $205,873 |
| 2023 | $2,602 | $377,000 | $127,829 | $249,171 |
| 2022 | $2,451 | $356,000 | $97,930 | $258,070 |
| 2021 | $2,097 | $278,000 | $72,832 | $205,168 |
| 2020 | $2,033 | $249,000 | $57,344 | $191,656 |
| 2019 | $2,009 | $231,000 | $47,244 | $183,756 |
| 2018 | $1,733 | $198,000 | $47,244 | $150,756 |
| 2017 | $1,640 | $175,000 | $41,816 | $133,184 |
| 2016 | $1,437 | $82,929 | $22,168 | $60,761 |
| 2015 | $1,360 | $76,562 | $22,168 | $54,394 |
| 2014 | $1,385 | $76,562 | $19,448 | $57,114 |
Source: Public Records
Map
Nearby Homes
- 1446 S 410 W Unit 135
- 404 Meadowbrook Dr
- 820 S Wildflower Cir
- 900 Century Dr Unit 130
- 900 Century Dr Unit 92
- 900 Century Dr Unit 7
- 900 Century Dr Unit 60
- 900 Century Dr Unit 66
- 870 Sunflower Dr
- 445 950 S
- 447 950 S
- 447 W 980 S
- 451 W 980 S
- 432 W 1100 S
- 446 S 150 W
- 130 7th #C304 St
- 142 7th St Unit B304
- 155 E 900 St S Unit 108
- 155 E 900 St S Unit 202
- 197 W 2nd St
Your Personal Tour Guide
Ask me questions while you tour the home.