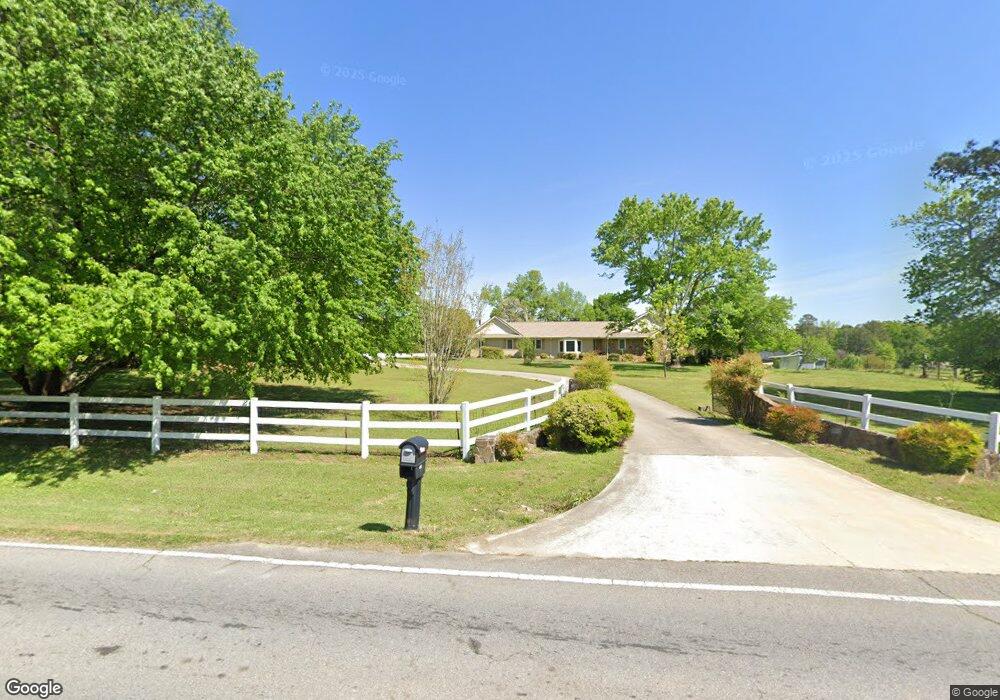
664 Sandhill Hulett Rd Villa Rica, GA 30180
Abilene NeighborhoodEstimated Value: $605,000 - $853,806
5
Beds
3
Baths
3,832
Sq Ft
$183/Sq Ft
Est. Value
About This Home
This home is located at 664 Sandhill Hulett Rd, Villa Rica, GA 30180 and is currently estimated at $701,702, approximately $183 per square foot. 664 Sandhill Hulett Rd is a home located in Carroll County with nearby schools including Sand Hill Elementary School, Bay Springs Middle School, and Villa Rica High School.
Ownership History
Date
Name
Owned For
Owner Type
Purchase Details
Closed on
Apr 5, 2018
Sold by
Stone Scarlett
Bought by
Stone Scarlett and Stone Dwayne
Current Estimated Value
Purchase Details
Closed on
May 11, 2017
Sold by
Coalwell Deborah
Bought by
Stone Scarlett and Stone Dwayne
Home Financials for this Owner
Home Financials are based on the most recent Mortgage that was taken out on this home.
Original Mortgage
$297,000
Interest Rate
4.08%
Mortgage Type
New Conventional
Purchase Details
Closed on
Nov 8, 2007
Sold by
Head William A
Bought by
Coalwell Deborah and Head William A
Purchase Details
Closed on
Jan 1, 2002
Sold by
Head William A
Bought by
Head William A
Purchase Details
Closed on
Dec 2, 2000
Sold by
Head William and Head Dorca
Bought by
Head William A
Purchase Details
Closed on
Apr 16, 1981
Bought by
Head William and Head Dorca
Create a Home Valuation Report for This Property
The Home Valuation Report is an in-depth analysis detailing your home's value as well as a comparison with similar homes in the area
Home Values in the Area
Average Home Value in this Area
Purchase History
| Date | Buyer | Sale Price | Title Company |
|---|---|---|---|
| Stone Scarlett | -- | -- | |
| Stone Scarlett | $330,000 | -- | |
| Coalwell Deborah | -- | -- | |
| Head William A | -- | -- | |
| Head William A | -- | -- | |
| Head William | -- | -- |
Source: Public Records
Mortgage History
| Date | Status | Borrower | Loan Amount |
|---|---|---|---|
| Previous Owner | Stone Scarlett | $297,000 |
Source: Public Records
Tax History Compared to Growth
Tax History
| Year | Tax Paid | Tax Assessment Tax Assessment Total Assessment is a certain percentage of the fair market value that is determined by local assessors to be the total taxable value of land and additions on the property. | Land | Improvement |
|---|---|---|---|---|
| 2024 | $6,619 | $308,273 | $123,984 | $184,289 |
| 2023 | $6,619 | $266,808 | $99,187 | $167,621 |
| 2022 | $5,036 | $200,781 | $66,124 | $134,657 |
| 2021 | $3,717 | $144,990 | $52,900 | $92,090 |
| 2020 | $3,339 | $130,074 | $48,090 | $81,984 |
| 2019 | $3,200 | $123,675 | $48,090 | $75,585 |
| 2018 | $2,803 | $106,726 | $42,394 | $64,332 |
| 2017 | $2,811 | $106,726 | $42,394 | $64,332 |
| 2016 | $2,812 | $106,726 | $42,394 | $64,332 |
| 2015 | $2,093 | $74,845 | $34,280 | $40,566 |
| 2014 | $2,102 | $74,846 | $34,280 | $40,566 |
Source: Public Records
Map
Nearby Homes
- 140 Fairfield Rd
- 102 Oak Place
- 137 Fawn Dr
- 278 Sandhill Hulett Rd
- 1497 Stonington Ct
- 3078 Essex Dr
- 395 Moss Ferry Rd
- 0 Carrollton Villa Rica Hwy Unit 10366072
- 4149 Golfview Dr
- 4082 Essex Dr
- 4079 Essex Dr
- 1436 Heritage Ct
- 1409 Northgate Dr
- 136 John Willis Ct
- 1431 Heritage Ct
- 3256 Greenhill Ct
- 1391 Lakeview Pkwy
- 11196 Lakeview Pkwy
- 613 Sandhill Hulett Rd
- 933 Moss Ferry Rd
- 631 Sandhill Hulett Rd
- 685 Sandhill Hulett Rd
- 925 Moss Ferry Rd
- 610 Sandhill Hulett Rd
- 895 Moss Ferry Rd Unit 1.76AC
- 895 Moss Ferry Rd
- 920 Moss Ferry Rd
- 703 Sandhill Hulett Rd
- 16 Fairfield Rd
- 416 William Rd
- 50 Fairfield Rd
- 66 Fairfield Rd
- 44 Fairfield Rd
- 890 Moss Ferry Rd
- 392 William Rd
- 887 Moss Ferry Rd
- 0 Fairfield Rd
- 0 Fairfield Rd Unit 10021068