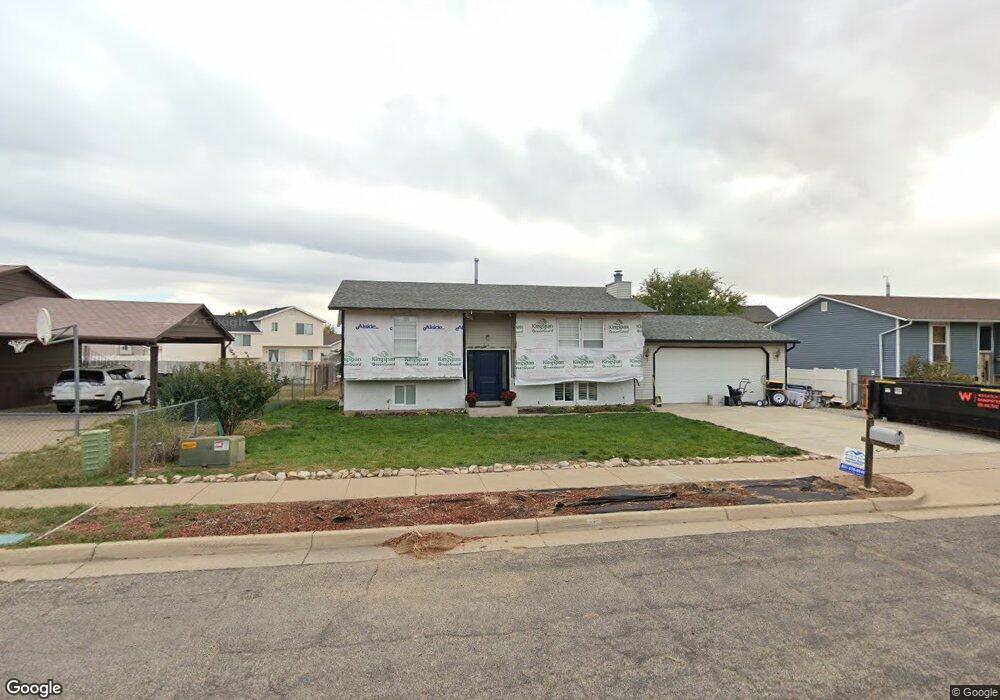
664 W 550 N Clearfield, UT 84015
Estimated Value: $412,000 - $445,000
5
Beds
3
Baths
976
Sq Ft
$439/Sq Ft
Est. Value
About This Home
This home is located at 664 W 550 N, Clearfield, UT 84015 and is currently estimated at $428,850, approximately $439 per square foot. 664 W 550 N is a home located in Davis County with nearby schools including Doxey School, North Davis Junior High School, and Clearfield High School.
Ownership History
Date
Name
Owned For
Owner Type
Purchase Details
Closed on
Jan 16, 2025
Sold by
Anaya Valerie and Holt Meriska Anaya
Bought by
Holt Meriska Anaya
Current Estimated Value
Purchase Details
Closed on
Sep 22, 2016
Sold by
Anaya Roberta C and Anaya Valerie
Bought by
Anaya Valerie and Holt Meriska Anaya
Purchase Details
Closed on
Jun 24, 2005
Sold by
Anaya Valerie
Bought by
Anaya Valerie and Anaya Roberta C
Purchase Details
Closed on
Aug 13, 2003
Sold by
Anaya Valdemar and Anaya Valerie
Bought by
Anaya Valerie
Purchase Details
Closed on
May 2, 2003
Sold by
Anaya Valerie and Anaya Elizabeth
Bought by
Anaya Valerie
Home Financials for this Owner
Home Financials are based on the most recent Mortgage that was taken out on this home.
Original Mortgage
$42,546
Interest Rate
5.72%
Create a Home Valuation Report for This Property
The Home Valuation Report is an in-depth analysis detailing your home's value as well as a comparison with similar homes in the area
Home Values in the Area
Average Home Value in this Area
Purchase History
| Date | Buyer | Sale Price | Title Company |
|---|---|---|---|
| Holt Meriska Anaya | -- | None Listed On Document | |
| Holt Meriska Anaya | -- | None Listed On Document | |
| Anaya Valerie | -- | None Available | |
| Anaya Valerie | -- | -- | |
| Anaya Valerie | -- | -- | |
| Anaya Valerie | -- | First American Title Co |
Source: Public Records
Mortgage History
| Date | Status | Borrower | Loan Amount |
|---|---|---|---|
| Previous Owner | Anaya Valerie | $42,546 |
Source: Public Records
Tax History Compared to Growth
Tax History
| Year | Tax Paid | Tax Assessment Tax Assessment Total Assessment is a certain percentage of the fair market value that is determined by local assessors to be the total taxable value of land and additions on the property. | Land | Improvement |
|---|---|---|---|---|
| 2025 | $2,486 | $222,750 | $72,093 | $150,657 |
| 2024 | $2,401 | $216,700 | $68,925 | $147,775 |
| 2023 | $2,215 | $367,000 | $110,323 | $256,677 |
| 2022 | $2,203 | $197,450 | $63,209 | $134,241 |
| 2021 | $1,920 | $260,000 | $67,057 | $192,943 |
| 2020 | $1,673 | $225,000 | $56,367 | $168,633 |
| 2019 | $1,635 | $217,000 | $59,172 | $157,828 |
| 2018 | $1,469 | $190,000 | $52,521 | $137,479 |
| 2016 | $1,258 | $85,030 | $20,970 | $64,060 |
| 2015 | $1,215 | $78,320 | $20,970 | $57,350 |
| 2014 | $1,124 | $73,431 | $20,970 | $52,461 |
| 2013 | -- | $63,084 | $26,730 | $36,354 |
Source: Public Records
Map
Nearby Homes