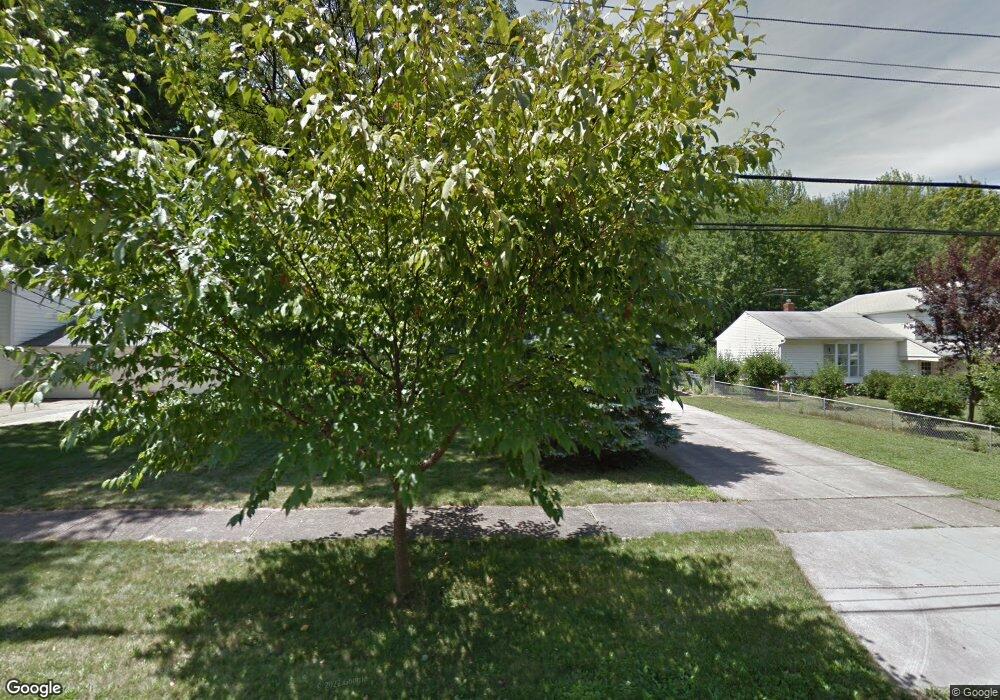
6640 Cypress Dr North Olmsted, OH 44070
Estimated Value: $234,789 - $285,000
3
Beds
2
Baths
1,421
Sq Ft
$187/Sq Ft
Est. Value
About This Home
This home is located at 6640 Cypress Dr, North Olmsted, OH 44070 and is currently estimated at $266,197, approximately $187 per square foot. 6640 Cypress Dr is a home located in Cuyahoga County with nearby schools including Chestnut Intermediate Elementary School, Pine Intermediate School, and North Olmsted Middle School.
Ownership History
Date
Name
Owned For
Owner Type
Purchase Details
Closed on
Jun 18, 1993
Sold by
Ford David A
Bought by
Starnes John L
Current Estimated Value
Purchase Details
Closed on
Jul 23, 1991
Sold by
Brasdovich Charles F
Bought by
Ford David A
Purchase Details
Closed on
Feb 13, 1990
Sold by
Brasdovich Charles F
Bought by
Brasdovich Charles F
Purchase Details
Closed on
Oct 31, 1988
Sold by
Thomas Timothy M and Thomas Janice L
Bought by
Brasdovich Charles F
Purchase Details
Closed on
Jun 24, 1985
Sold by
Jenkins James W
Bought by
Thomas Timothy M and Thomas Janice L
Purchase Details
Closed on
Jan 18, 1978
Sold by
Hecksel Ronald G
Bought by
Jenkins James W
Purchase Details
Closed on
Jan 10, 1977
Sold by
Mahoney Brian F and L J
Bought by
Hecksel Ronald G
Purchase Details
Closed on
Jan 1, 1975
Bought by
Mahoney Brian F and L J
Create a Home Valuation Report for This Property
The Home Valuation Report is an in-depth analysis detailing your home's value as well as a comparison with similar homes in the area
Home Values in the Area
Average Home Value in this Area
Purchase History
| Date | Buyer | Sale Price | Title Company |
|---|---|---|---|
| Starnes John L | $99,500 | -- | |
| Ford David A | $89,500 | -- | |
| Brasdovich Charles F | -- | -- | |
| Brasdovich Charles F | $72,500 | -- | |
| Thomas Timothy M | $63,000 | -- | |
| Jenkins James W | $49,500 | -- | |
| Hecksel Ronald G | $43,800 | -- | |
| Mahoney Brian F | -- | -- |
Source: Public Records
Tax History Compared to Growth
Tax History
| Year | Tax Paid | Tax Assessment Tax Assessment Total Assessment is a certain percentage of the fair market value that is determined by local assessors to be the total taxable value of land and additions on the property. | Land | Improvement |
|---|---|---|---|---|
| 2024 | $3,999 | $68,145 | $13,510 | $54,635 |
| 2023 | $3,848 | $56,290 | $14,180 | $42,110 |
| 2022 | $3,862 | $56,280 | $14,180 | $42,110 |
| 2021 | $3,495 | $56,280 | $14,180 | $42,110 |
| 2020 | $3,266 | $48,090 | $12,110 | $35,980 |
| 2019 | $3,178 | $137,400 | $34,600 | $102,800 |
| 2018 | $3,104 | $48,090 | $12,110 | $35,980 |
| 2017 | $3,038 | $42,880 | $10,920 | $31,960 |
| 2016 | $3,011 | $42,880 | $10,920 | $31,960 |
| 2015 | $2,916 | $42,880 | $10,920 | $31,960 |
| 2014 | $2,916 | $41,620 | $10,610 | $31,010 |
Source: Public Records
Map
Nearby Homes
- 6752 Cypress Dr
- 27097 Oakwood Cir Unit 208Z
- 6560 Mackenzie Rd
- 28130 Angela Dr
- 0 Stearns Rd
- 6926 Mackenzie Rd
- 6979 Warrington Dr
- 29695 Bretton Ridge Dr
- 6427 Mackenzie Rd
- 7097 Stearns Rd
- 6556 Louann Dr
- 6706 Crestwood Ln
- 6096 Sherwood Dr
- 29651 Westminster Dr
- 7087 Mackenzie Rd
- 29880 Westminster Dr
- 29408 Stewart Dr
- 7411 Stearns Rd
- 27202 Cook Rd Unit 95
- 27202 Cook Rd Unit 127
- 6640 Cypress 3bfr
- 6656 Cypress Dr
- 6624 Cypress Dr
- 6608 Cypress Dr
- 6672 Cypress Dr
- 6649 Cypress Dr
- 6688 Cypress Dr
- 6592 Cypress Dr
- 28697 Spruce Dr
- 6681 Cypress Dr
- 28698 Spruce Dr
- 6704 Cypress Dr
- 28698 Magnolia Dr
- 6574 Cypress Dr
- 28671 Spruce Dr
- 6585 Cypress Dr
- 28672 Spruce Dr
- 28672 Magnolia Dr
- 28699 Aspen Dr
- 6720 Cypress Dr