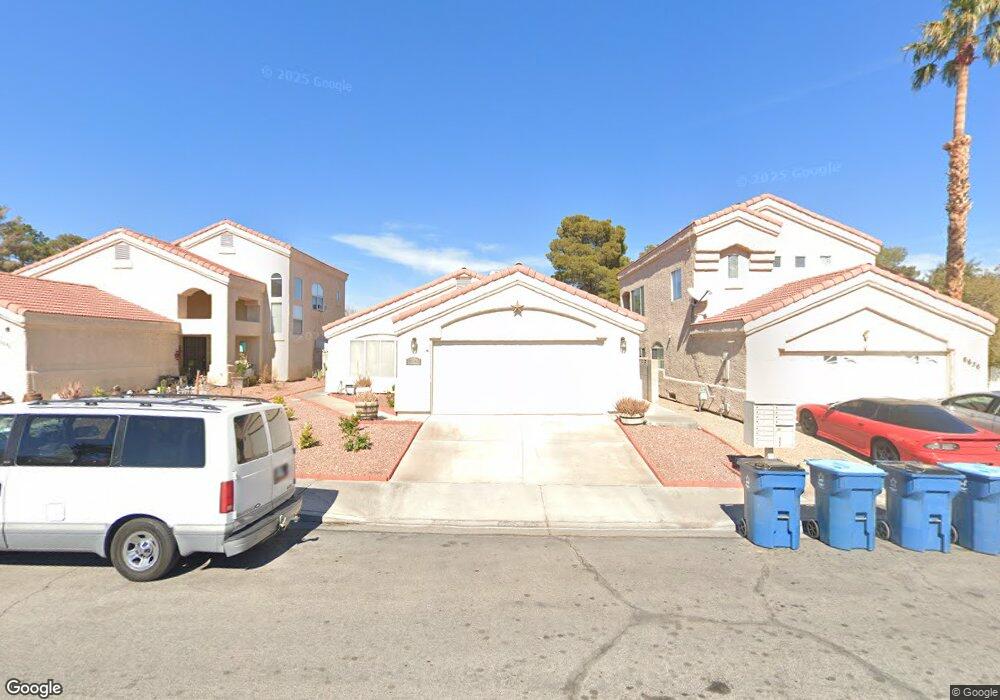
6640 Silver Penny Ave Unit II Las Vegas, NV 89108
Michael Way NeighborhoodEstimated Value: $355,245 - $387,000
3
Beds
2
Baths
1,249
Sq Ft
$296/Sq Ft
Est. Value
About This Home
This home is located at 6640 Silver Penny Ave Unit II, Las Vegas, NV 89108 and is currently estimated at $369,561, approximately $295 per square foot. 6640 Silver Penny Ave Unit II is a home located in Clark County with nearby schools including Berkeley L. Bunker Elementary School, Irwin & Susan Molasky Junior High School, and Cimarron Memorial High School.
Ownership History
Date
Name
Owned For
Owner Type
Purchase Details
Closed on
May 21, 2003
Sold by
Cirian Nikolas Drake and Cirian Mi Yong
Bought by
Crossen James D and Crossen Judith
Current Estimated Value
Home Financials for this Owner
Home Financials are based on the most recent Mortgage that was taken out on this home.
Original Mortgage
$105,600
Interest Rate
7.25%
Mortgage Type
Unknown
Purchase Details
Closed on
Dec 26, 1997
Sold by
Heisler Michele A and Lipsitz Dean L
Bought by
Cirian Nikolas Drake and Cirian Mi Yong
Home Financials for this Owner
Home Financials are based on the most recent Mortgage that was taken out on this home.
Original Mortgage
$108,120
Interest Rate
7.14%
Mortgage Type
VA
Purchase Details
Closed on
May 7, 1997
Sold by
Lipsitz Joseph and Lipsitz Helyn R
Bought by
Heisler Michele A and Lipsitz Dean L
Create a Home Valuation Report for This Property
The Home Valuation Report is an in-depth analysis detailing your home's value as well as a comparison with similar homes in the area
Home Values in the Area
Average Home Value in this Area
Purchase History
| Date | Buyer | Sale Price | Title Company |
|---|---|---|---|
| Crossen James D | $132,000 | Fidelity National Title | |
| Cirian Nikolas Drake | $106,000 | National Title Company | |
| Heisler Michele A | -- | -- |
Source: Public Records
Mortgage History
| Date | Status | Borrower | Loan Amount |
|---|---|---|---|
| Previous Owner | Crossen James D | $105,600 | |
| Previous Owner | Cirian Nikolas Drake | $108,120 | |
| Closed | Crossen James D | $26,400 |
Source: Public Records
Tax History Compared to Growth
Tax History
| Year | Tax Paid | Tax Assessment Tax Assessment Total Assessment is a certain percentage of the fair market value that is determined by local assessors to be the total taxable value of land and additions on the property. | Land | Improvement |
|---|---|---|---|---|
| 2025 | $1,160 | $65,856 | $26,250 | $39,606 |
| 2024 | $1,126 | $65,856 | $26,250 | $39,606 |
| 2023 | $1,126 | $64,625 | $26,600 | $38,025 |
| 2022 | $1,094 | $56,672 | $21,700 | $34,972 |
| 2021 | $1,062 | $53,756 | $20,300 | $33,456 |
| 2020 | $1,028 | $52,992 | $19,600 | $33,392 |
| 2019 | $998 | $49,959 | $16,800 | $33,159 |
| 2018 | $969 | $45,371 | $13,300 | $32,071 |
| 2017 | $1,482 | $45,200 | $12,600 | $32,600 |
| 2016 | $919 | $43,936 | $10,850 | $33,086 |
| 2015 | $916 | $38,209 | $7,000 | $31,209 |
| 2014 | $889 | $26,311 | $5,600 | $20,711 |
Source: Public Records
Map
Nearby Homes
- 6612 Gentle Winds Ct
- 6632 Light Breeze Dr
- 6544 Old Oxford Ave
- 6612 Old Newbury Ave
- 6632 Coastal Breeze Ct
- 2809 Du Barry Manor Ln
- 3116 Gentle Breeze St
- 3100 Garehime St
- 2801 N Rainbow Blvd Unit 252
- 2801 N Rainbow Blvd Unit 103
- 2801 N Rainbow Blvd Unit 273
- 6536 Castor Tree Way
- 2789 Trotwood Ln
- 2912 Drury St
- 2700 N Rainbow Blvd Unit 1137
- 2764 Trotwood Ln
- 6428 Yarmouth Dr
- 6705 Shallow Creek Ct
- 6561 Avon Ct
- 3265 Mustang St
- 6644 Silver Penny Ave Unit II
- 6636 Silver Penny Ave
- 6648 Silver Penny Ave
- 3000 Quiet Breeze Ct
- 6632 Silver Penny Ave Unit II
- 3001 Quiet Breeze Ct
- 6633 Silver Penny Ave
- 6652 Silver Penny Ave
- 6629 Silver Penny Ave
- 6629 Silver Penny Ave Unit None
- 3004 Quiet Breeze Ct
- 6649 Silver Penny Ave
- 6625 Gentle Winds Ct
- 6656 Silver Penny Ave
- 6624 Silver Penny Ave
- 2916 Old Majestic St
- 3005 Quiet Breeze Ct
- 6625 Silver Penny Ave
- 2921 Old Majestic St
- 6657 Silver Penny Ave