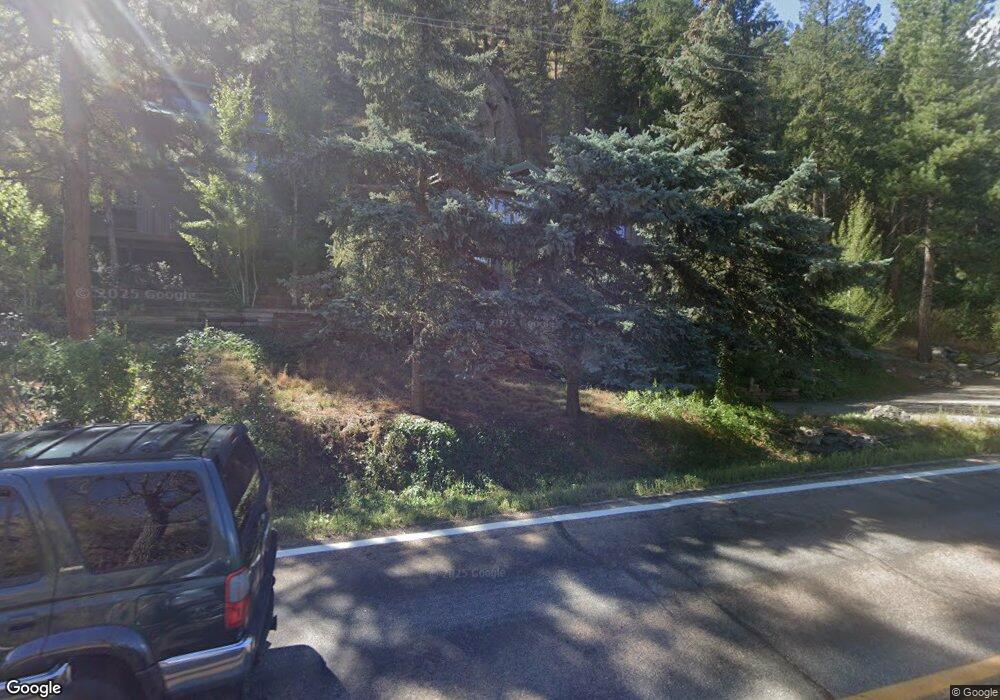
6641 Poudre Canyon Rd Bellvue, CO 80512
Estimated Value: $481,000 - $921,000
2
Beds
2
Baths
2,127
Sq Ft
$298/Sq Ft
Est. Value
About This Home
This home is located at 6641 Poudre Canyon Rd, Bellvue, CO 80512 and is currently estimated at $633,945, approximately $298 per square foot. 6641 Poudre Canyon Rd is a home located in Larimer County with nearby schools including Cache La Poudre Elementary School, Cache La Poudre Middle School, and Poudre High School.
Ownership History
Date
Name
Owned For
Owner Type
Purchase Details
Closed on
Jul 8, 2003
Sold by
Biggers James L and Biggers Mary M
Bought by
Biggers Mary M
Current Estimated Value
Home Financials for this Owner
Home Financials are based on the most recent Mortgage that was taken out on this home.
Original Mortgage
$140,000
Interest Rate
5.15%
Mortgage Type
Credit Line Revolving
Purchase Details
Closed on
Oct 3, 1996
Sold by
Biggers Mary M
Bought by
Biggers James L and Biggers Mary M
Home Financials for this Owner
Home Financials are based on the most recent Mortgage that was taken out on this home.
Original Mortgage
$200,000
Interest Rate
8.33%
Mortgage Type
Credit Line Revolving
Create a Home Valuation Report for This Property
The Home Valuation Report is an in-depth analysis detailing your home's value as well as a comparison with similar homes in the area
Home Values in the Area
Average Home Value in this Area
Purchase History
| Date | Buyer | Sale Price | Title Company |
|---|---|---|---|
| Biggers Mary M | -- | -- | |
| Biggers James L | -- | Land Title | |
| Biggers Mary M | -- | Land Title |
Source: Public Records
Mortgage History
| Date | Status | Borrower | Loan Amount |
|---|---|---|---|
| Closed | Biggers Mary M | $140,000 | |
| Closed | Biggers Mary M | $200,000 |
Source: Public Records
Tax History Compared to Growth
Tax History
| Year | Tax Paid | Tax Assessment Tax Assessment Total Assessment is a certain percentage of the fair market value that is determined by local assessors to be the total taxable value of land and additions on the property. | Land | Improvement |
|---|---|---|---|---|
| 2025 | $3,129 | $33,165 | $12,060 | $21,105 |
| 2024 | $2,992 | $33,165 | $12,060 | $21,105 |
| 2022 | $3,168 | $30,275 | $5,491 | $24,784 |
| 2021 | $3,207 | $31,146 | $5,649 | $25,497 |
| 2020 | $1,926 | $25,712 | $5,649 | $20,063 |
| 2019 | $1,934 | $25,712 | $5,649 | $20,063 |
| 2018 | $1,841 | $25,366 | $5,688 | $19,678 |
| 2017 | $1,835 | $25,366 | $5,688 | $19,678 |
| 2016 | $1,042 | $16,557 | $3,980 | $12,577 |
| 2015 | $1,035 | $16,560 | $3,980 | $12,580 |
| 2014 | $794 | $11,460 | $1,990 | $9,470 |
Source: Public Records
Map
Nearby Homes
- 31 Kings Canyon Rd
- 223 Kings Canyon Rd
- 7301 Poudre Canyon Rd
- 0 Wild River Rd Unit 1034487
- 0 Rd
- 200 Falls Creek Dr
- 0 Falls Creek Dr Unit 1048302
- 427 Wilderness Ridge Way
- 0 Pine Acres Rd Unit 1041697
- 0 Rist Creek Rd Unit 4284551
- 0 Rist Creek Rd Unit REC4803675
- 0 Tbd Stratton Park Rd Lot 3
- 0 Pine Acres Way Unit 1045910
- 620 Davis Ranch Rd
- 0 Dakota Valley Dr Unit 1041548
- 3805 Davis Ranch Rd
- 14884 Rist Canyon Rd
- 2518 Whale Rock Rd
- 0 Davis Ranch Rd Unit 1048176
- 4119 Davis Ranch Rd
- 21 Smith Bridge Rd
- 5 Smith Bridge Rd
- 6709 Poudre Canyon Rd
- 6785 Poudre Canyon Rd
- 41 Smith Bridge Rd
- 109 Smith Bridge Rd
- 81 Smith Bridge Rd
- 74 Smith Bridge Rd
- 0 Smith Bridge Rd Unit 8382691
- 0 Smith Bridge Rd Unit 652512
- 0 Smith Bridge Rd Unit Lot 15 689011
- 0 Smith Bridge Rd Unit 708711
- 0 Smith Bridge Rd Unit 788207
- 0 Smith Bridge Rd Unit 823300
- 0 Smith Bridge Rd Unit 862592
- 116 Smith Bridge Rd
- 132 Smith Bridge Rd
- 7020 Poudre Canyon Rd
- 200 Smith Bridge Rd
- 198 Smith Bridge Rd