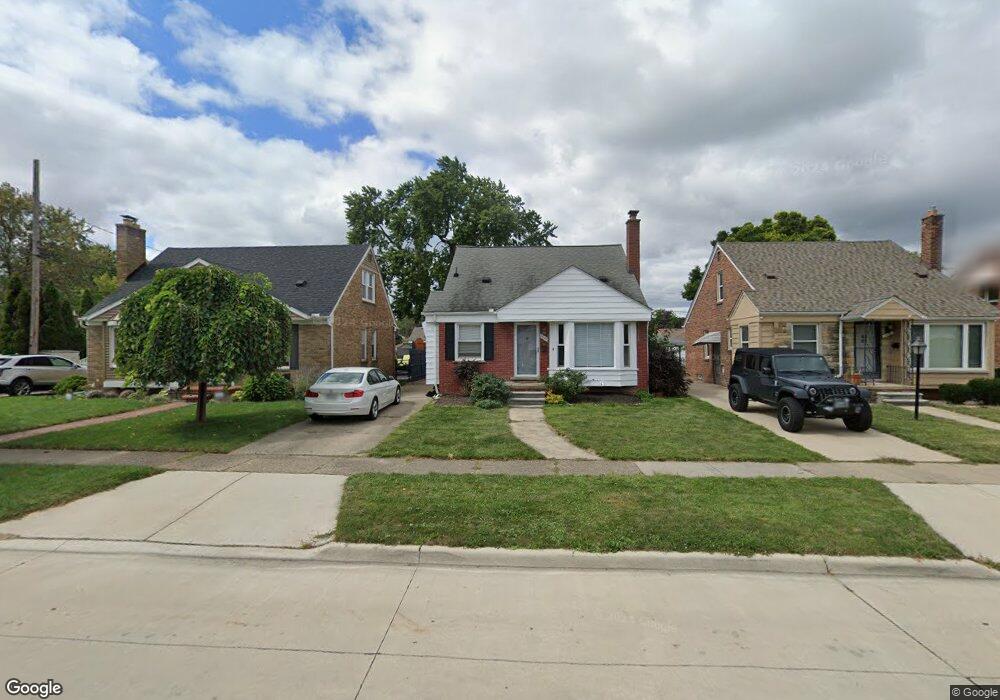
6642 Shenandoah Ave Unit Bldg-Unit Allen Park, MI 48101
Estimated Value: $213,000 - $221,000
--
Bed
1
Bath
1,117
Sq Ft
$193/Sq Ft
Est. Value
About This Home
This home is located at 6642 Shenandoah Ave Unit Bldg-Unit, Allen Park, MI 48101 and is currently estimated at $215,317, approximately $192 per square foot. 6642 Shenandoah Ave Unit Bldg-Unit is a home located in Wayne County with nearby schools including Bennie Elementary School, Allen Park Middle School, and Allen Park High School.
Ownership History
Date
Name
Owned For
Owner Type
Purchase Details
Closed on
Feb 14, 2023
Sold by
Phan Nguyen
Bought by
Moses Devin Pierre
Current Estimated Value
Home Financials for this Owner
Home Financials are based on the most recent Mortgage that was taken out on this home.
Original Mortgage
$161,500
Outstanding Balance
$156,515
Interest Rate
6.42%
Mortgage Type
New Conventional
Estimated Equity
$58,802
Purchase Details
Closed on
Aug 13, 2018
Sold by
Haskon Mary J
Bought by
Phan Nguyen
Purchase Details
Closed on
Jun 17, 2002
Sold by
Angellotti Marjorie D
Bought by
Haskin Mary J
Home Financials for this Owner
Home Financials are based on the most recent Mortgage that was taken out on this home.
Original Mortgage
$141,840
Interest Rate
6.8%
Create a Home Valuation Report for This Property
The Home Valuation Report is an in-depth analysis detailing your home's value as well as a comparison with similar homes in the area
Home Values in the Area
Average Home Value in this Area
Purchase History
| Date | Buyer | Sale Price | Title Company |
|---|---|---|---|
| Moses Devin Pierre | $170,000 | First American Title | |
| Moses Devin Pierre | $170,000 | First American Title | |
| Moses Devin Pierre | $170,000 | First American Title | |
| Phan Nguyen | $132,500 | None Available | |
| Haskin Mary J | $143,000 | -- |
Source: Public Records
Mortgage History
| Date | Status | Borrower | Loan Amount |
|---|---|---|---|
| Open | Moses Devin Pierre | $161,500 | |
| Closed | Moses Devin Pierre | $161,500 | |
| Previous Owner | Haskin Mary J | $141,840 |
Source: Public Records
Tax History Compared to Growth
Tax History
| Year | Tax Paid | Tax Assessment Tax Assessment Total Assessment is a certain percentage of the fair market value that is determined by local assessors to be the total taxable value of land and additions on the property. | Land | Improvement |
|---|---|---|---|---|
| 2025 | $3,957 | $86,300 | $0 | $0 |
| 2024 | $3,957 | $82,900 | $0 | $0 |
| 2023 | $2,786 | $76,500 | $0 | $0 |
| 2022 | $3,336 | $67,500 | $0 | $0 |
| 2021 | $3,245 | $62,000 | $0 | $0 |
| 2020 | $3,205 | $54,500 | $0 | $0 |
| 2019 | $3,182 | $51,900 | $0 | $0 |
| 2018 | $2,613 | $48,500 | $0 | $0 |
| 2017 | $948 | $48,000 | $0 | $0 |
| 2016 | $3,100 | $44,800 | $0 | $0 |
| 2015 | $3,799 | $41,400 | $0 | $0 |
| 2013 | $3,680 | $39,800 | $0 | $0 |
| 2012 | $2,888 | $38,500 | $12,600 | $25,900 |
Source: Public Records
Map
Nearby Homes
- 6642 Shenandoah Ave
- 6587 Cortland Ave
- 16546 Philomene Blvd
- 7140 Luana Ave
- 6505 Kolb Ave
- 7221 Winona Ave
- 6568 Balfour Ave
- 6345 Kolb Ave
- 7639 Cortland Ave
- 15777 Mclain Ave
- 7510 Balfour Ave
- 7668 Cortland Ave
- 7210 Buckingham Ave
- 16050 Beatrice Ave
- 16040 Beatrice Ave
- 6027 Kim Ave
- 15591 Garfield Ave
- 6789 Ziegler St
- 8027 Kolb Ave
- 15879 Horger Ave
- 6650 Shenandoah Ave
- 6634 Shenandoah Ave
- 6626 Shenandoah Ave
- 17006 Philomene Blvd
- 6616 Shenandoah Ave
- 6641 Larme Ave
- 6651 Larme Ave
- 6635 Larme Ave
- 17016 Philomene Blvd
- 6625 Larme Ave
- 17030 Philomene Blvd
- 6643 Shenandoah Ave
- 6651 Shenandoah Ave
- 6635 Shenandoah Ave
- 6617 Larme Ave
- 17040 Philomene Blvd
- 6627 Shenandoah Ave
- 6602 Shenandoah Ave
- 16846 Philomene Blvd
- 6609 Larme Ave