Estimated Value: $81,000 - $356,000
--
Bed
--
Bath
1,530
Sq Ft
$137/Sq Ft
Est. Value
About This Home
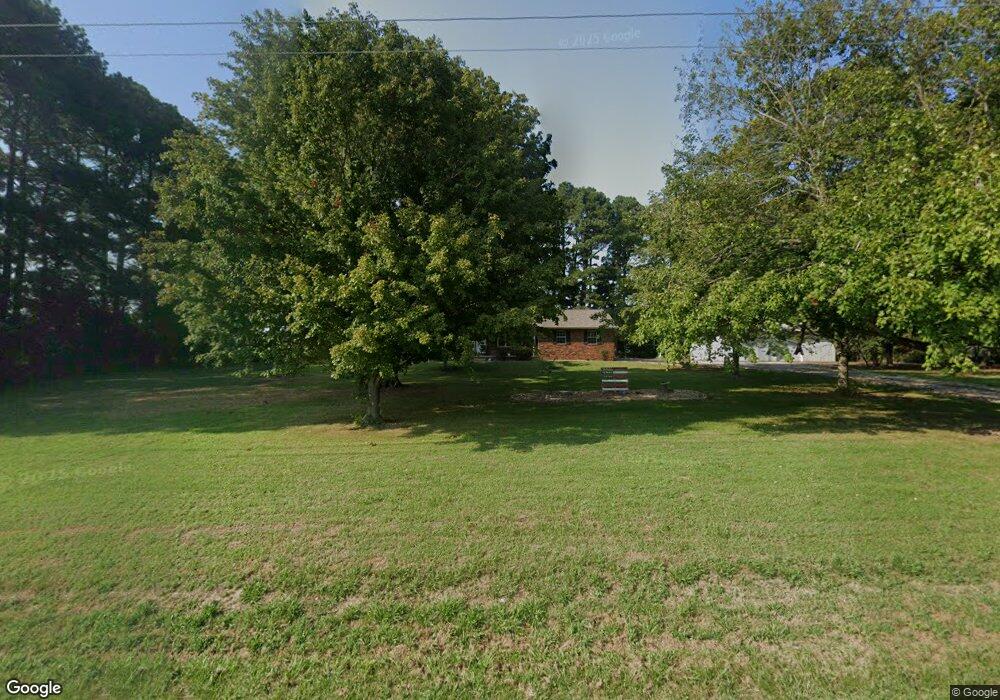
This home is located at 6643 State Route 161 Extension, Iuka, IL 62849 and is currently estimated at $209,463, approximately $136 per square foot. 6643 State Route 161 Extension is a home located in Marion County with nearby schools including Kell Grade School and Salem Community High School.
Ownership History
Date
Name
Owned For
Owner Type
Purchase Details
Closed on
Apr 13, 2010
Sold by
Donoho Arlen Brent and Donoho Rhonda Sue
Bought by
Phillips Howard E and Phillips Cynthia L
Current Estimated Value
Home Financials for this Owner
Home Financials are based on the most recent Mortgage that was taken out on this home.
Original Mortgage
$115,300
Outstanding Balance
$76,870
Interest Rate
5.02%
Mortgage Type
New Conventional
Estimated Equity
$132,593
Purchase Details
Closed on
Aug 12, 2005
Sold by
Schierbaum Barbara Lynn and Taylor Jason Lee
Bought by
Phillips Howard E and Phillips Cynthia L
Home Financials for this Owner
Home Financials are based on the most recent Mortgage that was taken out on this home.
Original Mortgage
$16,762
Interest Rate
5.69%
Mortgage Type
New Conventional
Create a Home Valuation Report for This Property
The Home Valuation Report is an in-depth analysis detailing your home's value as well as a comparison with similar homes in the area
Home Values in the Area
Average Home Value in this Area
Purchase History
| Date | Buyer | Sale Price | Title Company |
|---|---|---|---|
| Phillips Howard E | $55,000 | None Available | |
| Phillips Howard E | $3,000 | None Available |
Source: Public Records
Mortgage History
| Date | Status | Borrower | Loan Amount |
|---|---|---|---|
| Open | Phillips Howard E | $115,300 | |
| Previous Owner | Phillips Howard E | $16,762 |
Source: Public Records
Tax History Compared to Growth
Tax History
| Year | Tax Paid | Tax Assessment Tax Assessment Total Assessment is a certain percentage of the fair market value that is determined by local assessors to be the total taxable value of land and additions on the property. | Land | Improvement |
|---|---|---|---|---|
| 2024 | $2,776 | $51,850 | $5,770 | $46,080 |
| 2023 | $2,747 | $48,460 | $5,390 | $43,070 |
| 2022 | $2,652 | $44,050 | $4,900 | $39,150 |
| 2021 | $2,590 | $41,170 | $4,580 | $36,590 |
| 2020 | $2,766 | $41,780 | $2,670 | $39,110 |
| 2019 | $2,779 | $40,250 | $2,570 | $37,680 |
| 2018 | $2,890 | $40,250 | $2,570 | $37,680 |
| 2017 | $2,903 | $39,460 | $2,520 | $36,940 |
| 2016 | $2,918 | $37,940 | $2,420 | $35,520 |
| 2015 | $29 | $37,940 | $2,420 | $35,520 |
| 2012 | $29 | $37,200 | $2,380 | $34,820 |
Source: Public Records
Map
Nearby Homes
- 703 Buchanan Rd
- 7324 State Route 161 Extension
- 7003 River Rd
- 19188 E Divide Rd
- 1251 State Route 37
- 625 State Route 37
- 103 Middleton Rd
- 103 Middleton St
- 307 S Cherry St
- 405 Middleton St
- 308 S Main St
- 4248 Church Rd
- 4308 Church Rd
- 19503 N Moonbeam Ln
- 23392 Illinois 37
- 18492 N Moonbeam Ln
- 23392 N Il Hwy 37
- 2639 S Broadway Ave
- 2633 S Broadway Ave
- 0000 Jefferson Field Ln