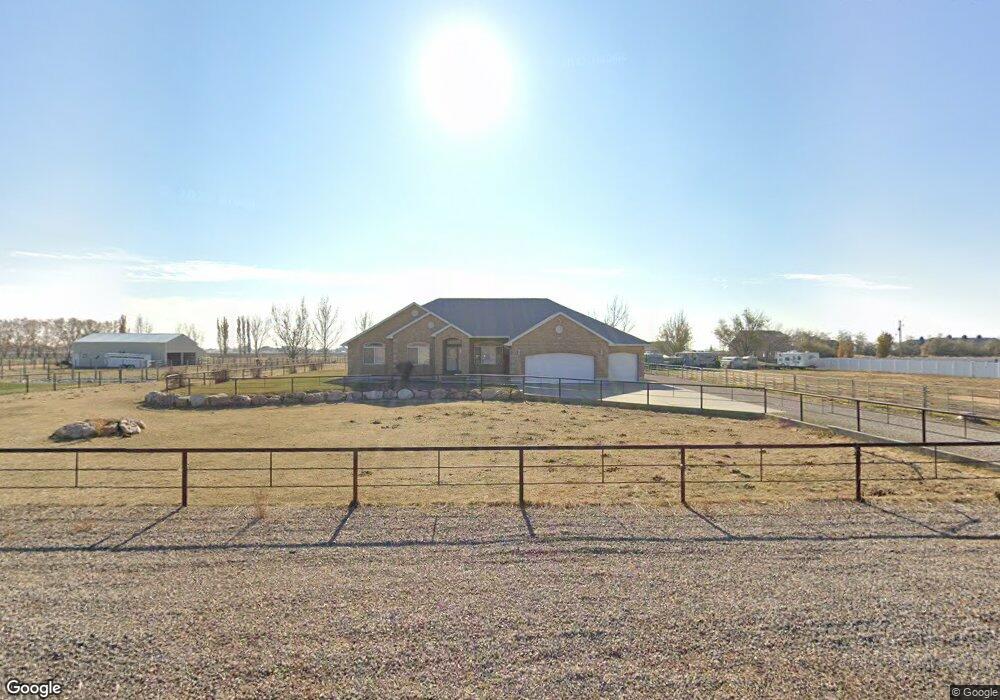
6643 W 5900 S Hooper, UT 84315
Estimated Value: $786,000 - $887,000
4
Beds
2
Baths
2,667
Sq Ft
$313/Sq Ft
Est. Value
About This Home
This home is located at 6643 W 5900 S, Hooper, UT 84315 and is currently estimated at $835,712, approximately $313 per square foot. 6643 W 5900 S is a home located in Weber County with nearby schools including Hooper Elementary School and Rocky Mountain Junior High School.
Ownership History
Date
Name
Owned For
Owner Type
Purchase Details
Closed on
Jan 30, 2020
Sold by
Perkins Mathew
Bought by
Perkins Mathew Lynn and Mathew Lynn Perkins
Current Estimated Value
Home Financials for this Owner
Home Financials are based on the most recent Mortgage that was taken out on this home.
Original Mortgage
$187,300
Outstanding Balance
$128,395
Interest Rate
3.7%
Mortgage Type
New Conventional
Estimated Equity
$707,317
Purchase Details
Closed on
Jan 24, 2020
Sold by
Perkins Matthew Lynn and Perkins Matthew Lynn
Bought by
Perkins Matthew
Home Financials for this Owner
Home Financials are based on the most recent Mortgage that was taken out on this home.
Original Mortgage
$187,300
Outstanding Balance
$128,395
Interest Rate
3.7%
Mortgage Type
New Conventional
Estimated Equity
$707,317
Purchase Details
Closed on
Aug 27, 2012
Sold by
Parkins Matt L and Perkins Lisa A
Bought by
Parkins Mathew Lynn and Parkins Lisa Ann
Create a Home Valuation Report for This Property
The Home Valuation Report is an in-depth analysis detailing your home's value as well as a comparison with similar homes in the area
Home Values in the Area
Average Home Value in this Area
Purchase History
| Date | Buyer | Sale Price | Title Company |
|---|---|---|---|
| Perkins Mathew Lynn | -- | Vanguard Title Ins Agcy | |
| Perkins Matthew | -- | Vanguard Title Ins Agcy | |
| Perkins Matthew | -- | Vanguard Title Ins Agcy | |
| Parkins Mathew Lynn | -- | None Available |
Source: Public Records
Mortgage History
| Date | Status | Borrower | Loan Amount |
|---|---|---|---|
| Open | Perkins Matthew | $187,300 |
Source: Public Records
Tax History Compared to Growth
Tax History
| Year | Tax Paid | Tax Assessment Tax Assessment Total Assessment is a certain percentage of the fair market value that is determined by local assessors to be the total taxable value of land and additions on the property. | Land | Improvement |
|---|---|---|---|---|
| 2025 | $4,828 | $829,854 | $251,165 | $578,689 |
| 2024 | $4,643 | $479,188 | $170,180 | $309,008 |
| 2023 | $4,011 | $408,875 | $143,502 | $265,373 |
| 2022 | $4,092 | $405,350 | $101,473 | $303,877 |
| 2021 | $3,597 | $600,000 | $140,600 | $459,400 |
| 2020 | $3,478 | $529,000 | $125,608 | $403,392 |
| 2019 | $3,385 | $485,001 | $125,600 | $359,401 |
| 2018 | $3,529 | $484,000 | $125,600 | $358,400 |
| 2017 | $3,581 | $484,000 | $116,700 | $367,300 |
| 2016 | $3,640 | $278,340 | $76,200 | $202,140 |
| 2015 | $3,302 | $249,464 | $56,950 | $192,514 |
| 2014 | $3,070 | $225,822 | $56,950 | $168,872 |
Source: Public Records
Map
Nearby Homes
- 5752 W 2425 N
- 5801 S 7100 W
- 6360 W 5500 S
- 5319 S 7100 W
- 0 W 5500 S
- 6014 W 5300 S
- 6036 W 4700 S
- 2084 N 4500 W
- 5335 W 5500 S
- 3632 S 5400 W
- 3729 S 5600 W Unit 6
- 3720 S 5600 W Unit 2
- 3719 S 5600 W Unit 7
- 4302 W 1550 N
- 4100 S 5900 W
- 2462 N Hooded Crane Ct
- 2444 N Hooded Crane Cir Unit 11
- 4146 S 5800 W Unit 5
- 4163 S 5800 W Unit 2
- 4879 S 5050 W