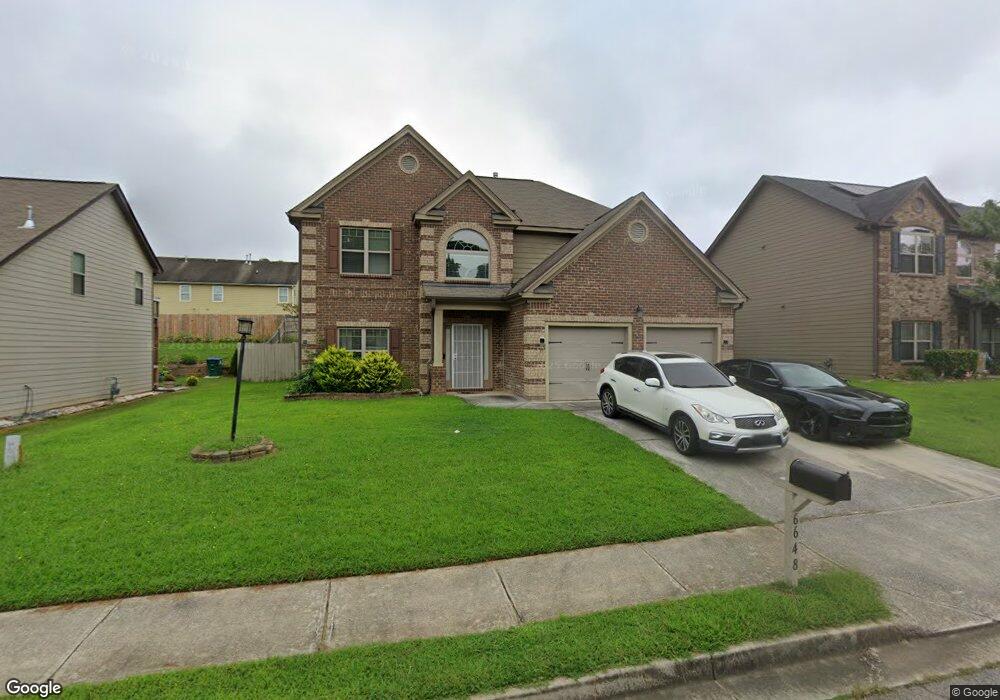
6648 Coker Way Unit 51 Jonesboro, GA 30238
Estimated Value: $316,233 - $356,000
3
Beds
3
Baths
2,283
Sq Ft
$148/Sq Ft
Est. Value
About This Home
This home is located at 6648 Coker Way Unit 51, Jonesboro, GA 30238 and is currently estimated at $338,308, approximately $148 per square foot. 6648 Coker Way Unit 51 is a home located in Clayton County with nearby schools including Brown Elementary School, Mundys Mill Middle School, and Mundy's Mill High School.
Ownership History
Date
Name
Owned For
Owner Type
Purchase Details
Closed on
Sep 13, 2022
Sold by
Brown Jennifer
Bought by
Burns Omar and Nelson Grace
Current Estimated Value
Home Financials for this Owner
Home Financials are based on the most recent Mortgage that was taken out on this home.
Original Mortgage
$333,841
Outstanding Balance
$319,868
Interest Rate
5.62%
Mortgage Type
FHA
Estimated Equity
$18,440
Purchase Details
Closed on
Nov 30, 2016
Sold by
Dr Horton Crown Llc
Bought by
Brown Jennifer
Home Financials for this Owner
Home Financials are based on the most recent Mortgage that was taken out on this home.
Original Mortgage
$191,876
Interest Rate
3.75%
Mortgage Type
FHA
Purchase Details
Closed on
May 7, 2013
Sold by
Atl 1Q11 Adc Llc
Bought by
Jefferson Homes Inc
Purchase Details
Closed on
May 30, 2012
Sold by
Atreus Communities Of Clay
Bought by
Atl 1Q11 Adc Llc and C/O Anthem Capital Partners Ll
Create a Home Valuation Report for This Property
The Home Valuation Report is an in-depth analysis detailing your home's value as well as a comparison with similar homes in the area
Home Values in the Area
Average Home Value in this Area
Purchase History
| Date | Buyer | Sale Price | Title Company |
|---|---|---|---|
| Burns Omar | $340,000 | -- | |
| Brown Jennifer | $195,416 | -- | |
| Jefferson Homes Inc | $217,000 | -- | |
| Atl 1Q11 Adc Llc | -- | -- |
Source: Public Records
Mortgage History
| Date | Status | Borrower | Loan Amount |
|---|---|---|---|
| Open | Burns Omar | $333,841 | |
| Previous Owner | Brown Jennifer | $191,876 |
Source: Public Records
Tax History Compared to Growth
Tax History
| Year | Tax Paid | Tax Assessment Tax Assessment Total Assessment is a certain percentage of the fair market value that is determined by local assessors to be the total taxable value of land and additions on the property. | Land | Improvement |
|---|---|---|---|---|
| 2024 | $4,841 | $123,120 | $10,400 | $112,720 |
| 2023 | $4,185 | $115,920 | $10,400 | $105,520 |
| 2022 | $4,030 | $111,720 | $10,400 | $101,320 |
| 2021 | $2,591 | $74,640 | $10,400 | $64,240 |
| 2020 | $2,604 | $74,165 | $10,400 | $63,765 |
| 2019 | $2,575 | $72,492 | $9,600 | $62,892 |
| 2018 | $2,541 | $71,665 | $9,600 | $62,065 |
| 2017 | $2,690 | $75,176 | $9,600 | $65,576 |
| 2016 | $429 | $9,600 | $9,600 | $0 |
| 2015 | $260 | $0 | $0 | $0 |
| 2014 | $149 | $2,800 | $2,800 | $0 |
Source: Public Records
Map
Nearby Homes
- 6648 Coker Way
- 6637 Chason Woods Ct
- 6632 Chason Woods Ct
- 1157 Mundys Mill Rd
- 1131 Orr Rd
- 9463 Rollinghills Dr
- 9744 Carolina Dr
- 9620 Carolina Dr
- 1506 Mundys Mill Rd
- 1254 Meadowbrook Drive Unit#179
- 1358 Riverstone Rd Unit 102
- 9468 Briarwood Ln
- 1255 Meadowbrook Dr
- 1314 Harmony Ridge Ct Unit LOT 200
- 1264 Harmony Ridge Ct
- 1256 Meadowbrook Dr
- 1265 Meadowbrook Dr
- 1277 Meadowbrook Dr
- 1260 Meadowbrook Dr
- 6642 Coker Way Unit 52
- 6642 Coker Way
- 6654 Coker Way
- 6643 Piazza Dr
- 6637 Piazza Dr
- 6649 Piazza Dr
- 6660 Coker Way Unit 49
- 6660 Coker Way
- 6636 Coker Way
- 6647 Coker Way Unit 34
- 6647 Coker Way
- 6653 Coker Way Unit 35
- 6653 Coker Way
- 6655 Piazza Dr
- 6641 Coker Way
- 6641 Coker Way Unit 33
- 6631 Piazza Dr
- 6692 Coker Way
- 0 Coker Way Unit 8820829
- 6659 Coker Way Unit 36