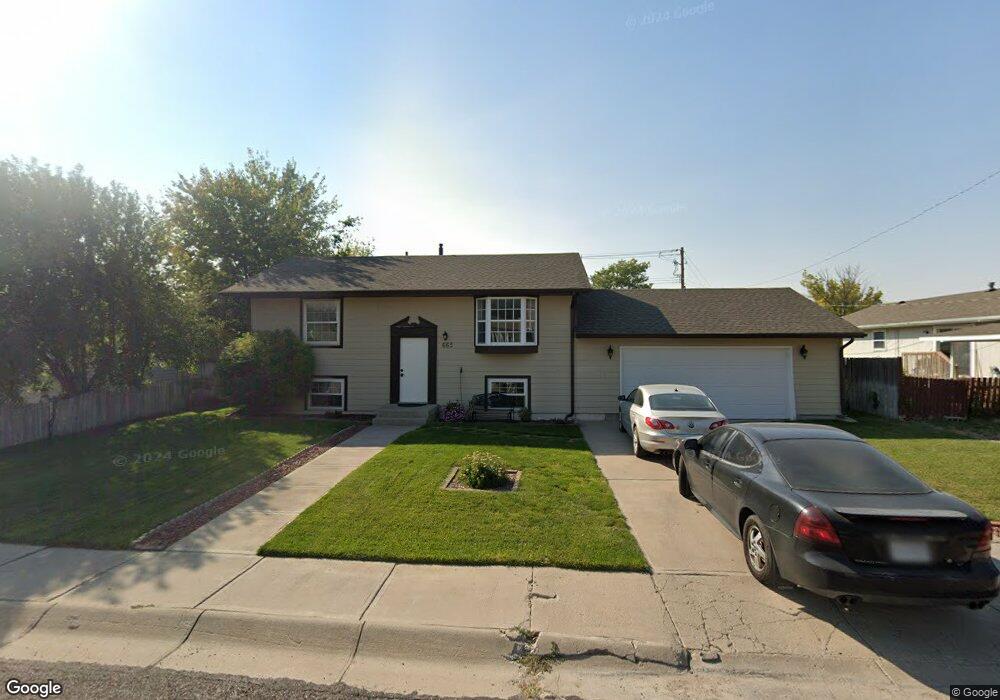
665 16th St Gering, NE 69341
Estimated Value: $195,999 - $224,000
4
Beds
2
Baths
816
Sq Ft
$260/Sq Ft
Est. Value
About This Home
This home is located at 665 16th St, Gering, NE 69341 and is currently estimated at $212,250, approximately $260 per square foot. 665 16th St is a home located in Scotts Bluff County with nearby schools including Gering High School and Community Christian Elementary/Middle School.
Ownership History
Date
Name
Owned For
Owner Type
Purchase Details
Closed on
Feb 12, 2010
Sold by
Oederkirk Travis E and Oederkirk Janelle
Bought by
Saenz Elizabeth P
Current Estimated Value
Home Financials for this Owner
Home Financials are based on the most recent Mortgage that was taken out on this home.
Original Mortgage
$1,000
Outstanding Balance
$666
Interest Rate
5.16%
Mortgage Type
Purchase Money Mortgage
Estimated Equity
$211,584
Purchase Details
Closed on
May 11, 2009
Sold by
Howe Janet Kay and Ouderkirk Janet Kay
Bought by
Ouderkirk Steven M
Create a Home Valuation Report for This Property
The Home Valuation Report is an in-depth analysis detailing your home's value as well as a comparison with similar homes in the area
Home Values in the Area
Average Home Value in this Area
Purchase History
| Date | Buyer | Sale Price | Title Company |
|---|---|---|---|
| Saenz Elizabeth P | $98,000 | -- | |
| Ouderkirk Steven M | -- | -- |
Source: Public Records
Mortgage History
| Date | Status | Borrower | Loan Amount |
|---|---|---|---|
| Open | Saenz Elizabeth P | $1,000 |
Source: Public Records
Tax History Compared to Growth
Tax History
| Year | Tax Paid | Tax Assessment Tax Assessment Total Assessment is a certain percentage of the fair market value that is determined by local assessors to be the total taxable value of land and additions on the property. | Land | Improvement |
|---|---|---|---|---|
| 2024 | $2,620 | $150,980 | $22,690 | $128,290 |
| 2023 | $2,591 | $120,906 | $18,563 | $102,343 |
| 2022 | $2,591 | $120,906 | $18,563 | $102,343 |
| 2021 | $2,200 | $101,516 | $18,563 | $82,953 |
| 2020 | $2,126 | $97,566 | $18,563 | $79,003 |
| 2019 | $2,075 | $97,566 | $18,563 | $79,003 |
| 2018 | $2,087 | $97,566 | $18,563 | $79,003 |
| 2017 | $2,025 | $94,527 | $18,563 | $75,964 |
| 2016 | $1,880 | $94,527 | $18,563 | $75,964 |
| 2015 | $1,830 | $92,314 | $18,563 | $73,751 |
| 2014 | $1,746 | $86,851 | $18,563 | $68,288 |
| 2012 | -- | $85,512 | $18,563 | $66,949 |
Source: Public Records
Map
Nearby Homes