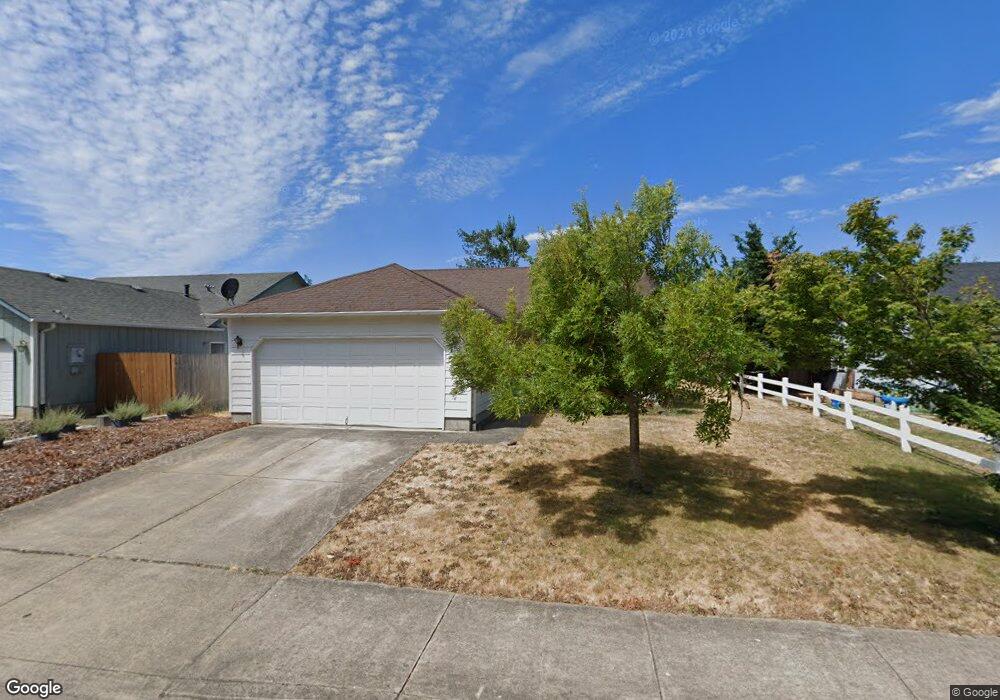
665 Blue Jay Loop Creswell, OR 97426
Estimated Value: $332,000 - $360,000
3
Beds
2
Baths
1,008
Sq Ft
$346/Sq Ft
Est. Value
About This Home
This home is located at 665 Blue Jay Loop, Creswell, OR 97426 and is currently estimated at $348,727, approximately $345 per square foot. 665 Blue Jay Loop is a home located in Lane County with nearby schools including Creslane Elementary School, Creswell Middle School, and Creswell High School.
Ownership History
Date
Name
Owned For
Owner Type
Purchase Details
Closed on
Aug 31, 2021
Sold by
New Richard L and Estate Of Clara L New
Bought by
New Christopher Jonathan
Current Estimated Value
Home Financials for this Owner
Home Financials are based on the most recent Mortgage that was taken out on this home.
Original Mortgage
$201,565
Outstanding Balance
$182,323
Interest Rate
2.7%
Mortgage Type
New Conventional
Estimated Equity
$166,404
Purchase Details
Closed on
Jan 11, 2000
Sold by
Hayden Enterprises Inc
Bought by
New Clara Lynn
Home Financials for this Owner
Home Financials are based on the most recent Mortgage that was taken out on this home.
Original Mortgage
$101,500
Interest Rate
7.54%
Create a Home Valuation Report for This Property
The Home Valuation Report is an in-depth analysis detailing your home's value as well as a comparison with similar homes in the area
Home Values in the Area
Average Home Value in this Area
Purchase History
| Date | Buyer | Sale Price | Title Company |
|---|---|---|---|
| New Christopher Jonathan | $263,000 | Fidelity Natl Ttl Co Of Or | |
| New Clara Lynn | $99,271 | Cascade Title Co |
Source: Public Records
Mortgage History
| Date | Status | Borrower | Loan Amount |
|---|---|---|---|
| Open | New Christopher Jonathan | $201,565 | |
| Previous Owner | New Clara Lynn | $101,500 |
Source: Public Records
Tax History
| Year | Tax Paid | Tax Assessment Tax Assessment Total Assessment is a certain percentage of the fair market value that is determined by local assessors to be the total taxable value of land and additions on the property. | Land | Improvement |
|---|---|---|---|---|
| 2025 | $3,121 | $190,143 | -- | -- |
| 2024 | $2,334 | $184,605 | -- | -- |
| 2023 | $2,334 | $179,229 | $0 | $0 |
| 2022 | $2,514 | $174,009 | $0 | $0 |
| 2021 | $2,429 | $168,941 | $0 | $0 |
| 2020 | $2,395 | $164,021 | $0 | $0 |
| 2019 | $2,342 | $159,244 | $0 | $0 |
| 2018 | $2,309 | $150,103 | $0 | $0 |
| 2017 | $2,240 | $150,103 | $0 | $0 |
| 2016 | $2,294 | $145,731 | $0 | $0 |
| 2015 | $2,211 | $141,486 | $0 | $0 |
| 2014 | $2,193 | $137,365 | $0 | $0 |
Source: Public Records
Map
Nearby Homes
- 689 Blue Jay Loop
- 156 N 1st St
- 109 Robin Ct
- 83354 N Pacific Hwy
- 632 N 5th St
- 700 N Mill St Unit 112
- 700 N Mill St Unit 1
- 700 N Mill St Unit 21
- 700 N Mill St Unit 107
- 276 Art Lott Ln
- 524 N 5th St
- 41 Sandalwood Loop
- 28 Sandalwood Loop
- 395 Ironwood Loop
- 460 Meadow Ln
- 33465 Irish Ln
- 272 S 7th St
- 958 Bush Ln
- 961 Bush Ln
- 1237 Spyglass Ct
- 647 Blue Jay Loop
- 674 N 1st St
- 658 N 1st St
- 711 Blue Jay Loop
- 633 Blue Jay Loop
- 678 Blue Jay Loop
- 656 Blue Jay Loop
- 636 N 1st St
- 696 Blue Jay Loop
- 714 N 1st St
- 632 Blue Jay Loop
- 704 Blue Jay Loop
- 727 Blue Jay Loop
- 605 Blue Jay Loop
- 752 N 1st St
- 610 N 1st St
- 610 Blue Jay Loop
- 716 Blue Jay Loop
- 779 Blue Jay Loop
- 113 Morse Ave
Your Personal Tour Guide
Ask me questions while you tour the home.