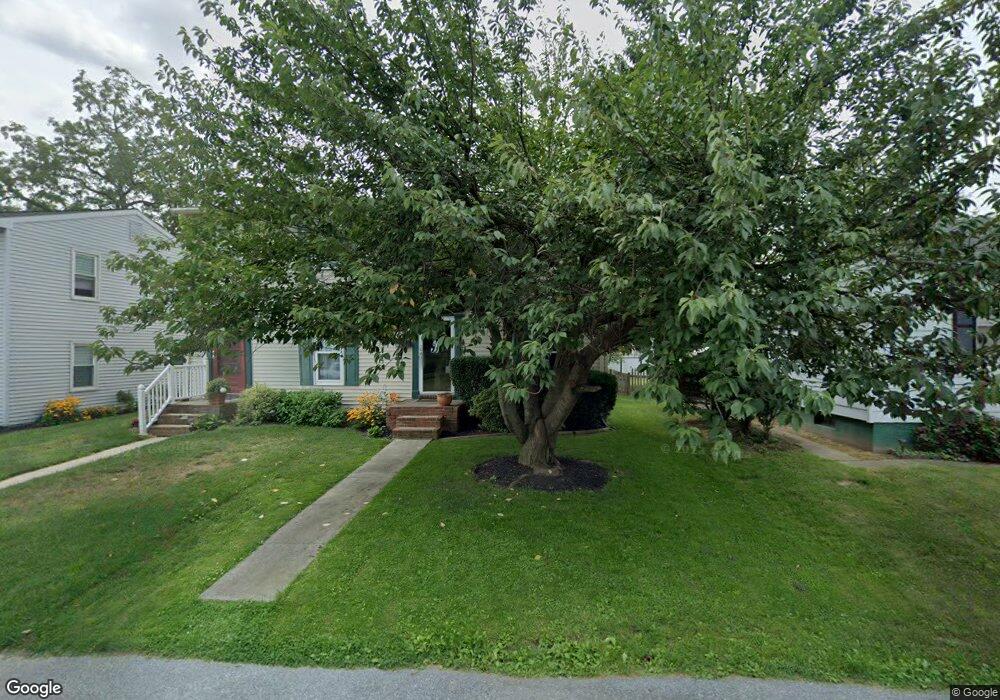
665 Eshelman St Highspire, PA 17034
Estimated Value: $175,000 - $198,985
3
Beds
2
Baths
1,392
Sq Ft
$135/Sq Ft
Est. Value
About This Home
This home is located at 665 Eshelman St, Highspire, PA 17034 and is currently estimated at $187,246, approximately $134 per square foot. 665 Eshelman St is a home located in Dauphin County with nearby schools including Steelton-Highspire High School, Seven Sorrows of BVM School, and The Samuel School.
Ownership History
Date
Name
Owned For
Owner Type
Purchase Details
Closed on
Jul 19, 2009
Sold by
Brady Paul F
Bought by
Bradshaw Roderick S
Current Estimated Value
Home Financials for this Owner
Home Financials are based on the most recent Mortgage that was taken out on this home.
Original Mortgage
$111,836
Outstanding Balance
$73,986
Interest Rate
5.58%
Mortgage Type
FHA
Estimated Equity
$113,260
Create a Home Valuation Report for This Property
The Home Valuation Report is an in-depth analysis detailing your home's value as well as a comparison with similar homes in the area
Home Values in the Area
Average Home Value in this Area
Purchase History
| Date | Buyer | Sale Price | Title Company |
|---|---|---|---|
| Bradshaw Roderick S | $113,900 | -- |
Source: Public Records
Mortgage History
| Date | Status | Borrower | Loan Amount |
|---|---|---|---|
| Open | Bradshaw Roderick S | $111,836 |
Source: Public Records
Tax History
| Year | Tax Paid | Tax Assessment Tax Assessment Total Assessment is a certain percentage of the fair market value that is determined by local assessors to be the total taxable value of land and additions on the property. | Land | Improvement |
|---|---|---|---|---|
| 2025 | $4,111 | $72,500 | $16,500 | $56,000 |
| 2024 | $3,893 | $72,500 | $16,500 | $56,000 |
| 2023 | $3,893 | $72,500 | $16,500 | $56,000 |
| 2022 | $3,893 | $72,500 | $16,500 | $56,000 |
| 2021 | $3,893 | $72,500 | $16,500 | $56,000 |
| 2020 | $3,893 | $72,500 | $16,500 | $56,000 |
| 2019 | $3,857 | $72,500 | $16,500 | $56,000 |
| 2018 | $3,767 | $72,500 | $16,500 | $56,000 |
| 2017 | $3,767 | $72,500 | $16,500 | $56,000 |
| 2016 | $0 | $72,500 | $16,500 | $56,000 |
| 2015 | -- | $72,500 | $16,500 | $56,000 |
| 2014 | -- | $72,500 | $16,500 | $56,000 |
Source: Public Records
Map
Nearby Homes
- 19 Crescent St
- 4 Nelson Manor Ln
- 158 Park Dr
- 1987 Market Street Extension
- 1204 Georgetown Rd
- 1500 Rosedale Ave
- 428 Edinburgh Rd Unit L8
- 211 Frederick St
- 16 Berkley Dr
- 312 Market St
- 264 2nd St
- 298 Poplar St
- 27 Nissley Dr
- 160 Hartford Dr
- 0 Walnut St
- 104 Paxton St
- 18 Jury St
- 912 Woodridge Dr
- 2400 Fulling Mill Rd
- 37 George Dr
Your Personal Tour Guide
Ask me questions while you tour the home.