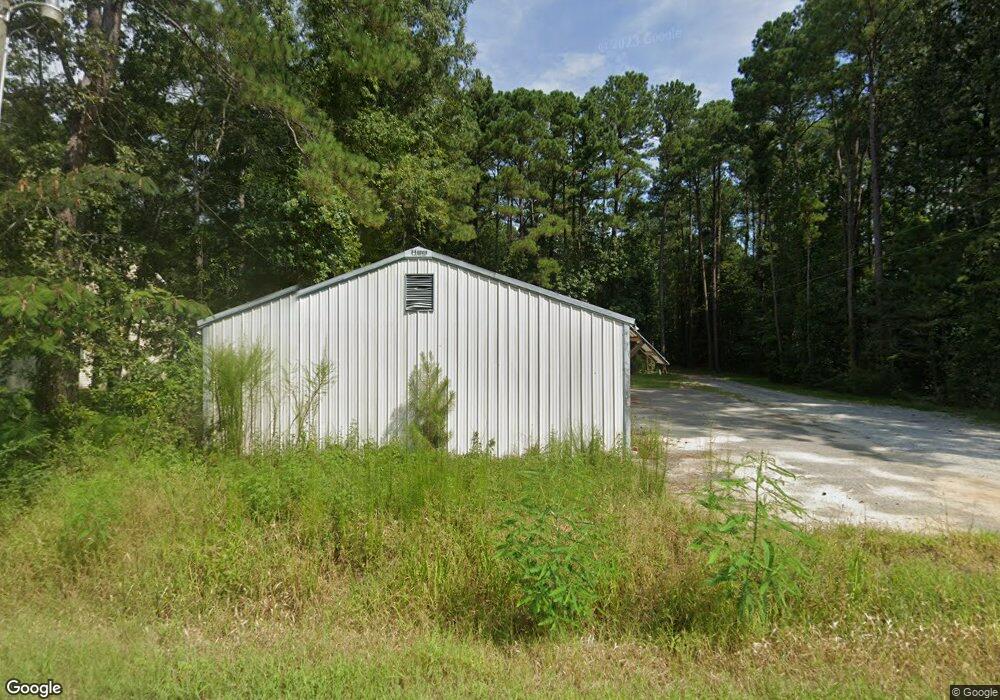
665 Gaillard Rd Moncks Corner, SC 29461
Estimated Value: $215,000 - $364,000
Studio
--
Bath
2,340
Sq Ft
$126/Sq Ft
Est. Value
About This Home
This home is located at 665 Gaillard Rd, Moncks Corner, SC 29461 and is currently estimated at $294,704, approximately $125 per square foot. 665 Gaillard Rd is a home with nearby schools including Whitesville Elementary School, Berkeley Middle School, and Berkeley High School.
Ownership History
Date
Name
Owned For
Owner Type
Purchase Details
Closed on
Jun 17, 2020
Sold by
Davis Connie B and Davis Robert J
Bought by
1120 Bexley Llc
Current Estimated Value
Purchase Details
Closed on
Jan 30, 2017
Sold by
Horne Chandler Brett
Bought by
Davis Connie B and Davis Robert J
Purchase Details
Closed on
Dec 30, 2010
Sold by
Chance Kenneth
Bought by
Smith Matthew James
Purchase Details
Closed on
Jul 24, 2009
Sold by
Investment Builders Inc
Bought by
Chance Kenneth William and Horne Chandler Brett
Home Financials for this Owner
Home Financials are based on the most recent Mortgage that was taken out on this home.
Original Mortgage
$150,000
Interest Rate
5.53%
Mortgage Type
Seller Take Back
Purchase Details
Closed on
Jun 1, 2004
Sold by
Hancock Raymond B
Bought by
Investment Builders Inc
Purchase Details
Closed on
Oct 25, 2001
Sold by
Lee Campbell Harold
Bought by
Kerley Brandy A and Gray Michael C
Create a Home Valuation Report for This Property
The Home Valuation Report is an in-depth analysis detailing your home's value as well as a comparison with similar homes in the area
Purchase History
| Date | Buyer | Sale Price | Title Company |
|---|---|---|---|
| 1120 Bexley Llc | $101,600 | None Available | |
| Davis Connie B | -- | None Available | |
| Davis Connie B | -- | None Available | |
| Smith Matthew James | -- | -- | |
| Chance Kenneth William | $150,000 | -- | |
| Investment Builders Inc | $85,200 | -- | |
| Kerley Brandy A | $15,000 | -- |
Source: Public Records
Mortgage History
| Date | Status | Borrower | Loan Amount |
|---|---|---|---|
| Previous Owner | Chance Kenneth William | $150,000 |
Source: Public Records
Tax History
| Year | Tax Paid | Tax Assessment Tax Assessment Total Assessment is a certain percentage of the fair market value that is determined by local assessors to be the total taxable value of land and additions on the property. | Land | Improvement |
|---|---|---|---|---|
| 2025 | $2,224 | $122,360 | $51,279 | $71,081 |
| 2024 | $2,198 | $7,342 | $3,077 | $4,265 |
| 2023 | $2,198 | $7,342 | $3,077 | $4,265 |
| 2022 | $1,952 | $6,384 | $948 | $5,436 |
| 2021 | $1,966 | $5,900 | $1,050 | $4,848 |
| 2020 | $1,845 | $5,898 | $1,050 | $4,848 |
| 2019 | $1,841 | $5,898 | $1,050 | $4,848 |
| 2018 | $1,893 | $5,748 | $900 | $4,848 |
| 2017 | $557 | $3,536 | $600 | $2,936 |
| 2016 | $568 | $3,540 | $600 | $2,940 |
| 2015 | $532 | $3,540 | $600 | $2,940 |
| 2014 | $523 | $3,540 | $600 | $2,940 |
| 2013 | -- | $3,540 | $600 | $2,940 |
Source: Public Records
Map
Nearby Homes
- 406 Stoney Field Dr
- 165 Stoney Creek Way
- 169 Stoney Creek Way
- 153 Sugeree Dr
- 222 Creek Pointe Dr
- 220 Creek Pointe Dr
- 0 Big Creek Dr
- 498 Stoney Field Dr
- 218 Creek Pointe Dr
- 0 Gaillard Rd
- 226 Creek Pointe Dr
- 403 Colchester Ct
- 405 Colchester Ct
- 409 Colchester Ct
- 411 Colchester Ct
- 221 Creek Pointe Dr
- 200 Creek Pointe Dr
- 510 Townsford Ln
- 223 Creek Pointe Dr
- 800 Creek Pointe Dr
- 661 Gaillard Rd
- 672 Gaillard Rd
- 656 Gaillard Rd
- 667 Gaillard Rd
- 666 Gaillard Rd
- 648 Gaillard Rd
- 309 Stone Post Rd
- 311 Stone Post Rd
- 307 Stone Post Rd
- 313 Stone Post Rd
- 646 Gaillard Rd
- 305 Stone Post Rd
- 315 Stone Post Rd
- 642 Gaillard Rd
- 317 Stone Post Rd
- 640 Gaillard Rd
- 303 Stone Post Rd
- 413 Stoney Field Dr
- 411 Stoney Field Dr
- 415 Stoney Field Dr
Your Personal Tour Guide
Ask me questions while you tour the home.