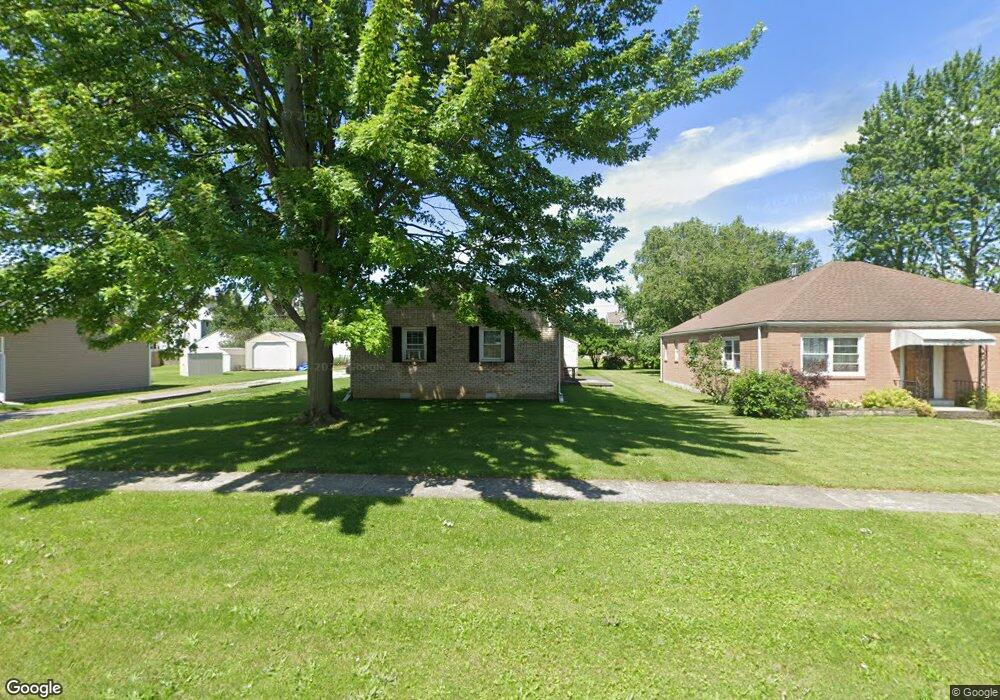
665 Maple St Fostoria, OH 44830
Estimated Value: $133,000 - $160,000
3
Beds
1
Bath
1,080
Sq Ft
$134/Sq Ft
Est. Value
About This Home
This home is located at 665 Maple St, Fostoria, OH 44830 and is currently estimated at $145,050, approximately $134 per square foot. 665 Maple St is a home located in Seneca County with nearby schools including Fostoria Intermediate Elementary School and Fostoria Junior/Senior High School.
Ownership History
Date
Name
Owned For
Owner Type
Purchase Details
Closed on
Mar 24, 2024
Sold by
Norris Lawrence O and Norris Leah
Bought by
Norris Lawrence O
Current Estimated Value
Purchase Details
Closed on
Nov 19, 2007
Sold by
Fannie Mae
Bought by
Norris Lawrence O
Home Financials for this Owner
Home Financials are based on the most recent Mortgage that was taken out on this home.
Original Mortgage
$46,440
Interest Rate
6.33%
Mortgage Type
New Conventional
Purchase Details
Closed on
Oct 1, 1998
Sold by
Jones Betty L
Bought by
Lehmann David J
Purchase Details
Closed on
Nov 7, 1997
Sold by
Jones Lawrence G
Bought by
Jones Betty L
Create a Home Valuation Report for This Property
The Home Valuation Report is an in-depth analysis detailing your home's value as well as a comparison with similar homes in the area
Home Values in the Area
Average Home Value in this Area
Purchase History
| Date | Buyer | Sale Price | Title Company |
|---|---|---|---|
| Norris Lawrence O | -- | None Listed On Document | |
| Norris Lawrence O | -- | None Listed On Document | |
| Norris Lawrence O | $44,500 | None Available | |
| Lehmann David J | $74,000 | -- | |
| Jones Betty L | -- | -- |
Source: Public Records
Mortgage History
| Date | Status | Borrower | Loan Amount |
|---|---|---|---|
| Previous Owner | Norris Lawrence O | $46,440 |
Source: Public Records
Tax History Compared to Growth
Tax History
| Year | Tax Paid | Tax Assessment Tax Assessment Total Assessment is a certain percentage of the fair market value that is determined by local assessors to be the total taxable value of land and additions on the property. | Land | Improvement |
|---|---|---|---|---|
| 2024 | $1,766 | $35,020 | $5,810 | $29,210 |
| 2023 | $1,770 | $35,020 | $5,810 | $29,210 |
| 2022 | $1,639 | $28,870 | $4,820 | $24,050 |
| 2021 | $1,674 | $28,870 | $4,820 | $24,050 |
| 2020 | $1,682 | $28,865 | $4,820 | $24,045 |
| 2019 | $1,597 | $27,199 | $4,652 | $22,547 |
| 2018 | $1,722 | $27,199 | $4,652 | $22,547 |
| 2017 | $1,606 | $27,199 | $4,652 | $22,547 |
| 2016 | $1,517 | $26,695 | $4,953 | $21,742 |
| 2015 | $1,400 | $26,695 | $4,953 | $21,742 |
| 2014 | $1,332 | $26,695 | $4,953 | $21,742 |
| 2013 | $1,564 | $29,015 | $5,383 | $23,632 |
Source: Public Records
Map
Nearby Homes
- 633 Maple St
- 540 N Poplar St
- 220 E High St
- 723 N Union St
- 931 N Union St
- 520 N Union St
- 207 W Culbertson St
- 827 Buckley St
- 892 N Countyline St
- 900 N Countyline St
- 321 Mcdougal St
- 711 Circle Dr
- 703 Glenwood Ave
- 203 N Union St
- 435 Park Ave
- 1324 N Union St
- 481 Beverly Dr
- 412 E Center St
- 603 N Vine St
- 375 Thomas St