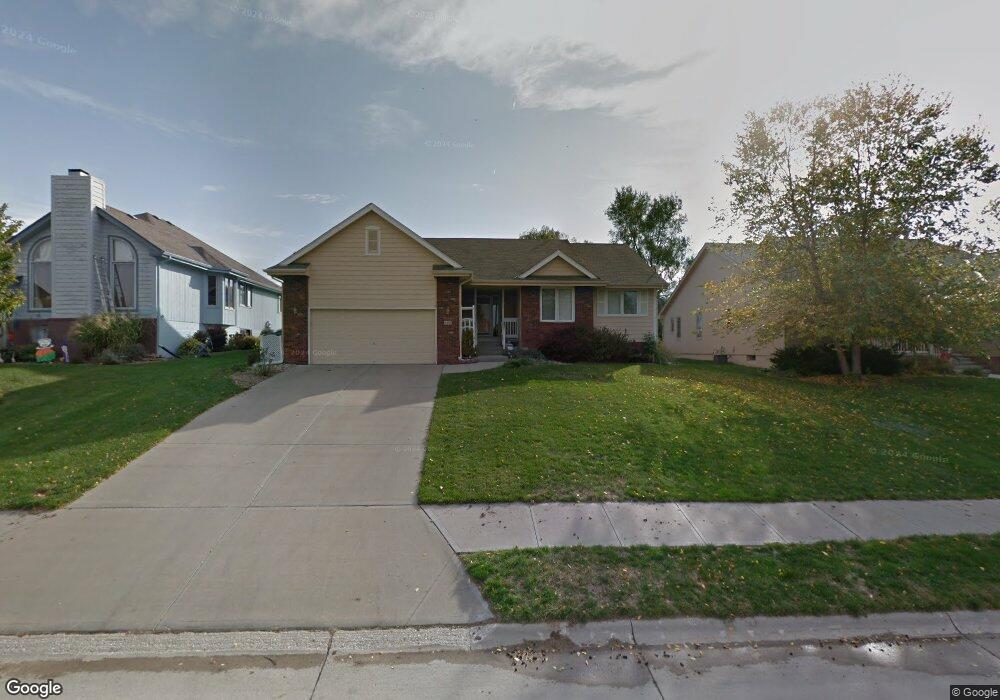
665 N 6th St Springfield, NE 68059
Estimated Value: $297,000 - $370,000
3
Beds
3
Baths
1,756
Sq Ft
$186/Sq Ft
Est. Value
About This Home
This home is located at 665 N 6th St, Springfield, NE 68059 and is currently estimated at $326,932, approximately $186 per square foot. 665 N 6th St is a home located in Sarpy County with nearby schools including Platteview Central Junior High School and Platteview Senior High School.
Ownership History
Date
Name
Owned For
Owner Type
Purchase Details
Closed on
Feb 5, 2009
Sold by
Cloyd Kenneth E and Cloyd Sheryl A
Bought by
White Brian A and White Christine M
Current Estimated Value
Home Financials for this Owner
Home Financials are based on the most recent Mortgage that was taken out on this home.
Original Mortgage
$120,000
Interest Rate
4.91%
Mortgage Type
Purchase Money Mortgage
Purchase Details
Closed on
Oct 10, 2001
Sold by
Kildow David P and Kildow Marla K
Bought by
Cloyd Kenneth E and Cloyd Sheryl A
Home Financials for this Owner
Home Financials are based on the most recent Mortgage that was taken out on this home.
Original Mortgage
$117,000
Interest Rate
6.84%
Purchase Details
Closed on
May 1, 2000
Sold by
Robert Hoppe and Robert Patricia A
Bought by
Kildow David P and Kildow Marla K
Create a Home Valuation Report for This Property
The Home Valuation Report is an in-depth analysis detailing your home's value as well as a comparison with similar homes in the area
Purchase History
| Date | Buyer | Sale Price | Title Company |
|---|---|---|---|
| White Brian A | $169,000 | None Available | |
| Cloyd Kenneth E | $151,000 | -- | |
| Kildow David P | $7,000 | Dakota Title & Escrow Co |
Source: Public Records
Mortgage History
| Date | Status | Borrower | Loan Amount |
|---|---|---|---|
| Closed | White Brian A | $120,000 | |
| Closed | Cloyd Kenneth E | $117,000 |
Source: Public Records
Tax History
| Year | Tax Paid | Tax Assessment Tax Assessment Total Assessment is a certain percentage of the fair market value that is determined by local assessors to be the total taxable value of land and additions on the property. | Land | Improvement |
|---|---|---|---|---|
| 2025 | $3,445 | $318,183 | $35,000 | $283,183 |
| 2024 | $4,130 | $278,369 | $35,000 | $243,369 |
| 2023 | $4,130 | $256,151 | $28,000 | $228,151 |
| 2022 | $4,125 | $225,980 | $28,000 | $197,980 |
| 2021 | $4,377 | $218,976 | $24,000 | $194,976 |
| 2020 | $4,632 | $216,273 | $24,000 | $192,273 |
| 2019 | $4,498 | $207,472 | $20,000 | $187,472 |
| 2018 | $4,235 | $193,356 | $20,000 | $173,356 |
| 2017 | $4,259 | $185,907 | $20,000 | $165,907 |
| 2016 | $4,109 | $177,345 | $20,000 | $157,345 |
| 2015 | $3,937 | $167,634 | $20,000 | $147,634 |
| 2014 | $3,903 | $164,857 | $20,000 | $144,857 |
| 2012 | -- | $172,738 | $20,000 | $152,738 |
Source: Public Records
Map
Nearby Homes
- 455 Hilltop Ave
- 360 Main St
- 225 N 10th Ave
- 505 S 7th Ave
- SE 1/4 18-13-12 Platteview Rd
- 13268 Bluebird Ct
- 19970 S 172 Plaza Cir
- 111 acres Platteview Rd
- Lots 103 to 106 Villa Springs
- 0 Capehart Rd
- 2040 Platteview Dr
- 200 Pr 6631
- Lot 108
- 9865 Fowler Dr
- 12214 S 113th St
- 12210 S 113th St
- 12202 S 113th St
- 11306 Portage Cir
- 12236 S 111th Ave
- 11908 S 118th St
Your Personal Tour Guide
Ask me questions while you tour the home.