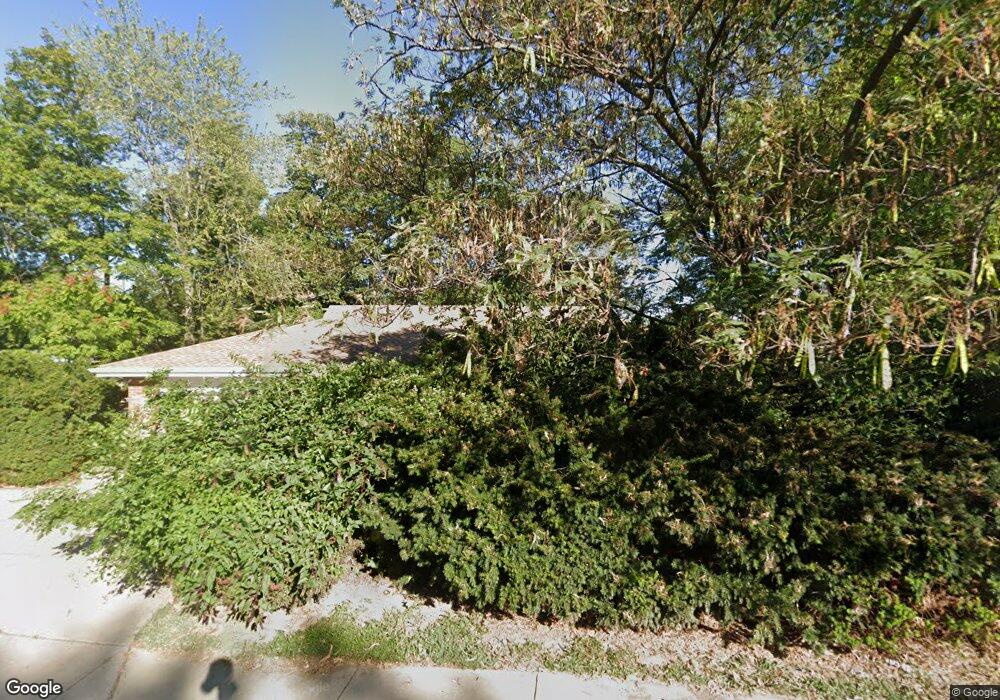
665 Shackelford Rd Florissant, MO 63031
Estimated Value: $190,000 - $231,000
3
Beds
2
Baths
1,617
Sq Ft
$131/Sq Ft
Est. Value
About This Home
This home is located at 665 Shackelford Rd, Florissant, MO 63031 and is currently estimated at $212,393, approximately $131 per square foot. 665 Shackelford Rd is a home located in St. Louis County with nearby schools including Lusher Elementary School, Northwest Middle School, and Hazelwood West High School.
Ownership History
Date
Name
Owned For
Owner Type
Purchase Details
Closed on
Jan 20, 2003
Sold by
Derhake John H and Derhake Loretta
Bought by
Derhake Lawrence J and Derhake Sharon A
Current Estimated Value
Home Financials for this Owner
Home Financials are based on the most recent Mortgage that was taken out on this home.
Original Mortgage
$65,000
Interest Rate
6.16%
Mortgage Type
Seller Take Back
Create a Home Valuation Report for This Property
The Home Valuation Report is an in-depth analysis detailing your home's value as well as a comparison with similar homes in the area
Home Values in the Area
Average Home Value in this Area
Purchase History
| Date | Buyer | Sale Price | Title Company |
|---|---|---|---|
| Derhake Lawrence J | $100,000 | -- |
Source: Public Records
Mortgage History
| Date | Status | Borrower | Loan Amount |
|---|---|---|---|
| Closed | Derhake Lawrence J | $65,000 |
Source: Public Records
Tax History Compared to Growth
Tax History
| Year | Tax Paid | Tax Assessment Tax Assessment Total Assessment is a certain percentage of the fair market value that is determined by local assessors to be the total taxable value of land and additions on the property. | Land | Improvement |
|---|---|---|---|---|
| 2025 | $2,808 | $38,480 | $7,980 | $30,500 |
| 2024 | $2,808 | $31,460 | $3,990 | $27,470 |
| 2023 | $2,808 | $31,460 | $3,990 | $27,470 |
| 2022 | $2,387 | $23,830 | $5,190 | $18,640 |
| 2021 | $2,325 | $23,830 | $5,190 | $18,640 |
| 2020 | $2,371 | $22,850 | $5,260 | $17,590 |
| 2019 | $2,335 | $22,850 | $5,260 | $17,590 |
| 2018 | $2,313 | $20,820 | $3,230 | $17,590 |
| 2017 | $2,311 | $20,820 | $3,230 | $17,590 |
| 2016 | $2,313 | $20,560 | $3,230 | $17,330 |
| 2015 | $2,264 | $20,560 | $3,230 | $17,330 |
| 2014 | -- | $21,630 | $6,160 | $15,470 |
Source: Public Records
Map
Nearby Homes
- 2165 Jenkee Dr
- 2128 Friendship Ct
- 1405 Miller Dr
- 660 Herbst Dr
- 400 Raymond Dr
- 25 Francisca Dr
- 425 Gerald Ave
- 200 Francisca Dr
- 1625 Charbonier Rd
- 185 Eldorado Dr
- 2484 Blue Heron Dr
- 2 Aspen at Koch Park Manors
- 2 Aspen II at Koch Park Manors
- 2317 Fernau Ct
- 2321 Fernau Ct
- 2316 Fernau Ct
- 2620 Lindsay Ln
- 2320 Fernau Ct
- 2 Sterling at Koch Park Manors
- 2324 Fernau Ct
- 2125 Jenkee Dr
- 685 Shackelford Rd
- 804 Torero Ln
- 2100 Jenkee Dr
- 808 Torero Ln
- 2110 Jenkee Dr
- 2135 Jenkee Dr
- 2085 Jenkee Ave
- 720 Shackelford Rd
- 800 Torero Ln
- 2120 Jenkee Dr
- 812 Torero Ln
- 687 Shackelford Rd
- 2080 Jenkee Ave
- 1661 Cobblestone
- 1661 Cobblestone Creek Dr
- 2065 Jenkee Ave
- 2145 Jenkee Dr
- 1590 Miller Dr
- 2130 Jenkee Dr