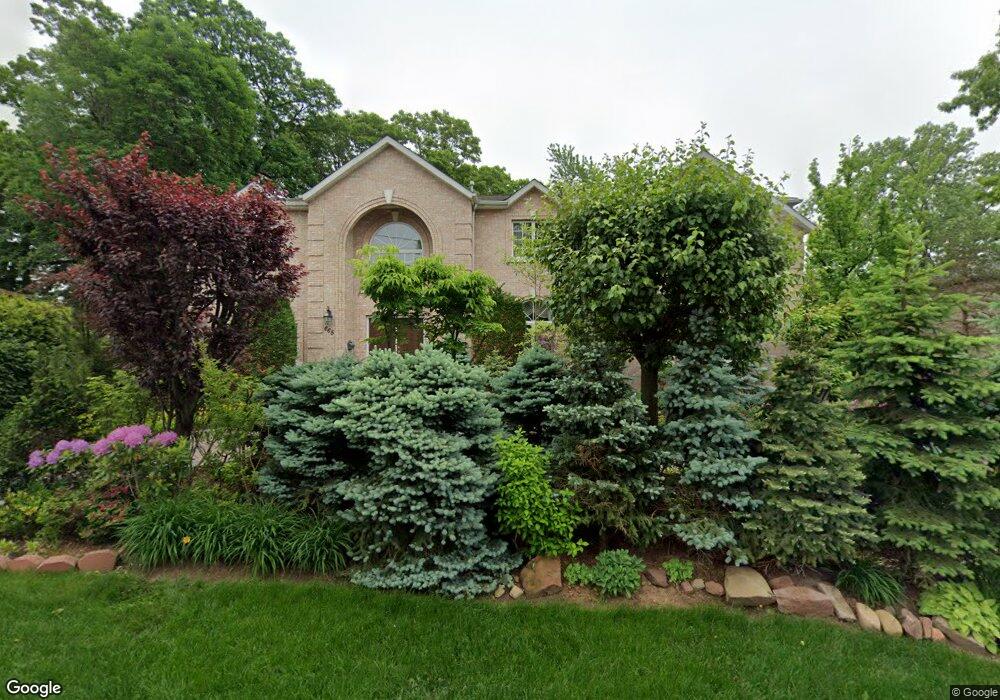
665 Summit St Englewood Cliffs, NJ 07632
Estimated Value: $2,753,000 - $3,547,000
--
Bed
--
Bath
4,926
Sq Ft
$627/Sq Ft
Est. Value
About This Home
This home is located at 665 Summit St, Englewood Cliffs, NJ 07632 and is currently estimated at $3,089,497, approximately $627 per square foot. 665 Summit St is a home located in Bergen County with nearby schools including North Cliff Elementary School, Upper School Elementary School, and Dwight-Englewood School.
Ownership History
Date
Name
Owned For
Owner Type
Purchase Details
Closed on
Jun 11, 2003
Sold by
Deve Michael and Deve Son
Bought by
Lee Mu and Lee Young
Current Estimated Value
Home Financials for this Owner
Home Financials are based on the most recent Mortgage that was taken out on this home.
Original Mortgage
$600,000
Outstanding Balance
$256,527
Interest Rate
5.45%
Estimated Equity
$2,832,970
Purchase Details
Closed on
Dec 18, 2002
Sold by
Okechuku Michael I
Bought by
Michael And Son Development Co
Purchase Details
Closed on
Aug 21, 2000
Bought by
Zhou Qiang
Home Financials for this Owner
Home Financials are based on the most recent Mortgage that was taken out on this home.
Original Mortgage
$400,000
Interest Rate
7.83%
Purchase Details
Closed on
Aug 26, 1993
Sold by
Pelicott William
Bought by
Zhou Quiang and Liu Sherry
Create a Home Valuation Report for This Property
The Home Valuation Report is an in-depth analysis detailing your home's value as well as a comparison with similar homes in the area
Home Values in the Area
Average Home Value in this Area
Purchase History
| Date | Buyer | Sale Price | Title Company |
|---|---|---|---|
| Lee Mu | $1,350,000 | -- | |
| Michael And Son Development Co | $707,500 | -- | |
| Zhou Qiang | -- | -- | |
| Zhou Qiang | -- | -- | |
| Zhou Quiang | $385,000 | -- |
Source: Public Records
Mortgage History
| Date | Status | Borrower | Loan Amount |
|---|---|---|---|
| Open | Lee Mu | $600,000 | |
| Previous Owner | Zhou Qiang | $400,000 |
Source: Public Records
Tax History Compared to Growth
Tax History
| Year | Tax Paid | Tax Assessment Tax Assessment Total Assessment is a certain percentage of the fair market value that is determined by local assessors to be the total taxable value of land and additions on the property. | Land | Improvement |
|---|---|---|---|---|
| 2025 | $24,255 | $2,100,000 | $1,009,000 | $1,091,000 |
| 2024 | $23,961 | $2,100,000 | $1,009,000 | $1,091,000 |
| 2023 | $23,583 | $2,100,000 | $1,009,000 | $1,091,000 |
| 2022 | $23,583 | $2,100,000 | $1,009,000 | $1,091,000 |
| 2021 | $23,604 | $2,100,000 | $1,009,000 | $1,091,000 |
| 2020 | $24,171 | $2,100,000 | $1,009,000 | $1,091,000 |
| 2019 | $22,701 | $2,100,000 | $1,009,000 | $1,091,000 |
| 2018 | $21,903 | $2,100,000 | $1,009,000 | $1,091,000 |
| 2017 | $20,958 | $2,100,000 | $1,009,000 | $1,091,000 |
| 2016 | $20,559 | $2,100,000 | $1,009,000 | $1,091,000 |
| 2015 | $19,530 | $2,100,000 | $1,009,000 | $1,091,000 |
| 2014 | $20,509 | $2,357,400 | $1,009,000 | $1,348,400 |
Source: Public Records
Map
Nearby Homes