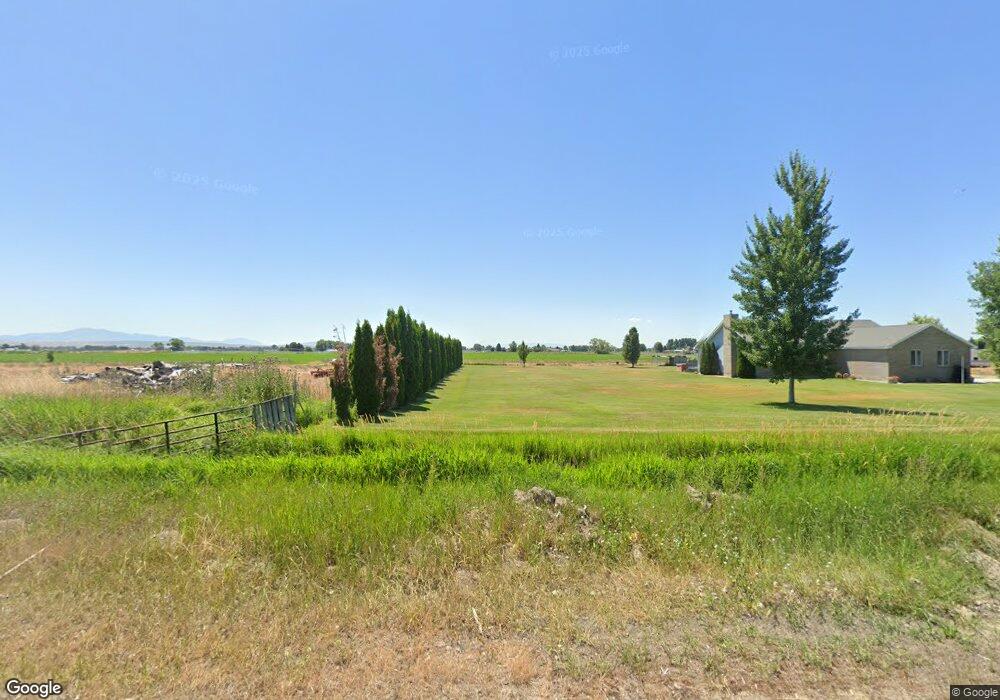
665 W 150 N Blackfoot, ID 83221
Estimated Value: $342,000 - $460,443
3
Beds
1
Bath
1,728
Sq Ft
$233/Sq Ft
Est. Value
About This Home
This home is located at 665 W 150 N, Blackfoot, ID 83221 and is currently estimated at $401,861, approximately $232 per square foot. 665 W 150 N is a home with nearby schools including Moreland Elementary School, Riverside Elementary School, and Rockford Elementary School.
Ownership History
Date
Name
Owned For
Owner Type
Purchase Details
Closed on
Dec 31, 2024
Sold by
Harper Kimberly Ann and B & K Harper Farms Llc
Bought by
B & K Gravel And Equipment
Current Estimated Value
Purchase Details
Closed on
Feb 3, 2021
Sold by
Harper Kimberly and Harper Brent
Bought by
Harper Brent
Purchase Details
Closed on
Feb 2, 2021
Sold by
Clark Harriet Agnes Driscoll and Zabriskie Janice Clark
Bought by
Harper Brent and Harper Danny
Create a Home Valuation Report for This Property
The Home Valuation Report is an in-depth analysis detailing your home's value as well as a comparison with similar homes in the area
Home Values in the Area
Average Home Value in this Area
Purchase History
| Date | Buyer | Sale Price | Title Company |
|---|---|---|---|
| B & K Gravel And Equipment | -- | None Listed On Document | |
| B & K Gravel And Equipment | -- | None Listed On Document | |
| Harper Brent | -- | First American Title | |
| Harper Brent | -- | First American Title |
Source: Public Records
Tax History Compared to Growth
Tax History
| Year | Tax Paid | Tax Assessment Tax Assessment Total Assessment is a certain percentage of the fair market value that is determined by local assessors to be the total taxable value of land and additions on the property. | Land | Improvement |
|---|---|---|---|---|
| 2025 | $1,359 | $228,202 | $70,000 | $158,202 |
| 2024 | $1,359 | $226,220 | $55,000 | $171,220 |
| 2023 | $1,348 | $211,929 | $55,000 | $156,929 |
| 2022 | $2,264 | $211,158 | $55,000 | $156,158 |
| 2021 | $1,906 | $203,008 | $47,000 | $156,008 |
| 2020 | $1,821 | $160,377 | $0 | $0 |
| 2019 | $1,958 | $160,377 | $0 | $0 |
| 2018 | $2,108 | $160,377 | $42,587 | $117,790 |
| 2017 | $2,189 | $158,785 | $40,995 | $117,790 |
| 2016 | $2,178 | $158,785 | $0 | $0 |
| 2015 | $1,962 | $158,785 | $0 | $0 |
| 2014 | $1,962 | $158,785 | $40,995 | $117,790 |
Source: Public Records
Map
Nearby Homes