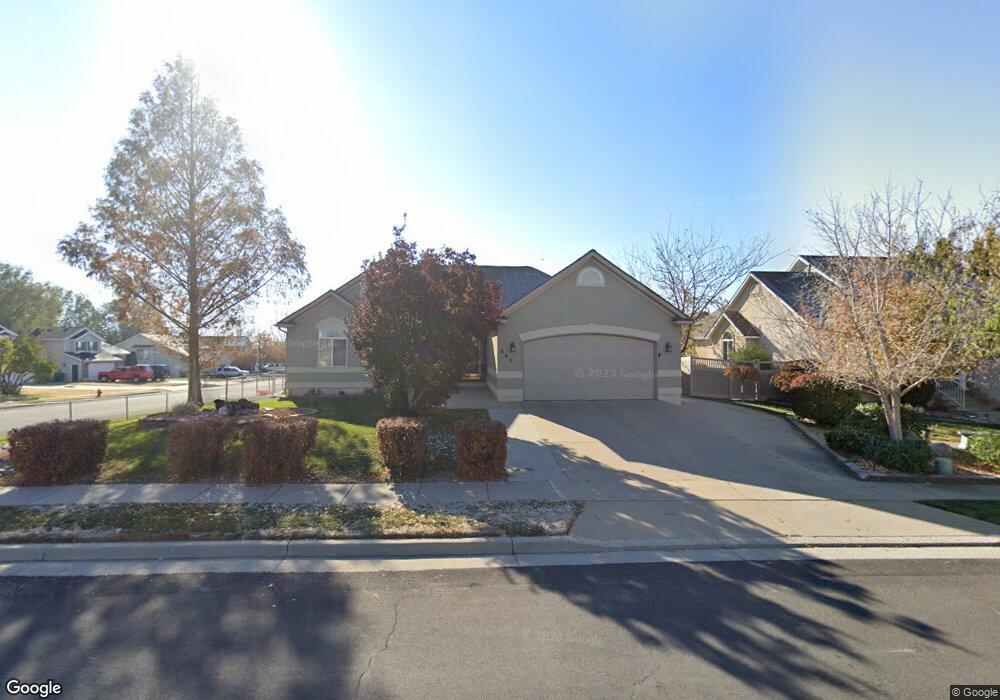
665 W 2175 N Layton, UT 84041
Estimated Value: $528,000 - $578,000
5
Beds
3
Baths
2,882
Sq Ft
$192/Sq Ft
Est. Value
About This Home
This home is located at 665 W 2175 N, Layton, UT 84041 and is currently estimated at $553,507, approximately $192 per square foot. 665 W 2175 N is a home located in Davis County with nearby schools including Lincoln Elementary School, North Layton Junior High School, and Northridge High School.
Ownership History
Date
Name
Owned For
Owner Type
Purchase Details
Closed on
Sep 15, 2023
Sold by
Johnson Lynnette
Bought by
Cline Nathan R
Current Estimated Value
Home Financials for this Owner
Home Financials are based on the most recent Mortgage that was taken out on this home.
Original Mortgage
$489,250
Interest Rate
7.79%
Mortgage Type
New Conventional
Purchase Details
Closed on
Feb 28, 1997
Sold by
Prymek Terrance Dale and Prymek Lynette Johnson
Bought by
Prymek Terrance D and Johnson Prymek Lynette
Purchase Details
Closed on
Oct 25, 1996
Sold by
Sli Commercial Real Estate Co
Bought by
Prymek Terrance Dale and Prymek Lynette Johnson
Home Financials for this Owner
Home Financials are based on the most recent Mortgage that was taken out on this home.
Original Mortgage
$153,000
Interest Rate
8.11%
Mortgage Type
VA
Create a Home Valuation Report for This Property
The Home Valuation Report is an in-depth analysis detailing your home's value as well as a comparison with similar homes in the area
Home Values in the Area
Average Home Value in this Area
Purchase History
| Date | Buyer | Sale Price | Title Company |
|---|---|---|---|
| Cline Nathan R | -- | Stewart Title | |
| Prymek Terrance D | -- | Security Title Company | |
| Prymek Terrance Dale | -- | Security Title Company | |
| Prymek Terrance Dale | -- | Security Title Company |
Source: Public Records
Mortgage History
| Date | Status | Borrower | Loan Amount |
|---|---|---|---|
| Previous Owner | Cline Nathan R | $489,250 | |
| Previous Owner | Prymek Terrance Dale | $153,000 |
Source: Public Records
Tax History Compared to Growth
Tax History
| Year | Tax Paid | Tax Assessment Tax Assessment Total Assessment is a certain percentage of the fair market value that is determined by local assessors to be the total taxable value of land and additions on the property. | Land | Improvement |
|---|---|---|---|---|
| 2025 | $2,688 | $282,150 | $98,660 | $183,490 |
| 2024 | $2,575 | $272,250 | $114,853 | $157,397 |
| 2023 | $2,629 | $490,000 | $135,566 | $354,434 |
| 2022 | $2,701 | $273,351 | $71,968 | $201,383 |
| 2021 | $2,504 | $378,000 | $101,724 | $276,276 |
| 2020 | $2,279 | $330,000 | $85,267 | $244,733 |
| 2019 | $2,207 | $313,000 | $80,688 | $232,312 |
| 2018 | $2,051 | $292,000 | $80,688 | $211,312 |
| 2016 | $1,810 | $132,935 | $25,990 | $106,945 |
| 2015 | $1,781 | $124,190 | $25,990 | $98,200 |
| 2014 | $1,733 | $123,536 | $25,990 | $97,546 |
| 2013 | $1,778 | $120,006 | $26,884 | $93,122 |
Source: Public Records
Map
Nearby Homes
- 2149 N 750 W
- 2211 N 525 W
- 506 W 2200 N
- 2248 N 500 W
- 2233 N 475 W
- 538 W 1875 N
- 2298 N 1085 W
- 1155 W 2200 N
- 2053 Evans Cove Loop Unit 39
- 1715 N Alder St
- 1908 N 200 W
- 2048 Evans Cove Loop
- 95 W 2400 N
- 2600 N Hill Field Rd Unit 108
- 2600 N Hill Field Rd Unit 4
- 1683 N 250 W
- 2500 N Fort Ln Unit 238
- 2875 N Hill Field Rd Unit 17
- 2875 N Hill Field Rd Unit 199
- 2875 N Hill Field Rd Unit 58