Estimated Value: $641,000 - $785,118
4
Beds
2
Baths
2,280
Sq Ft
$322/Sq Ft
Est. Value
About This Home
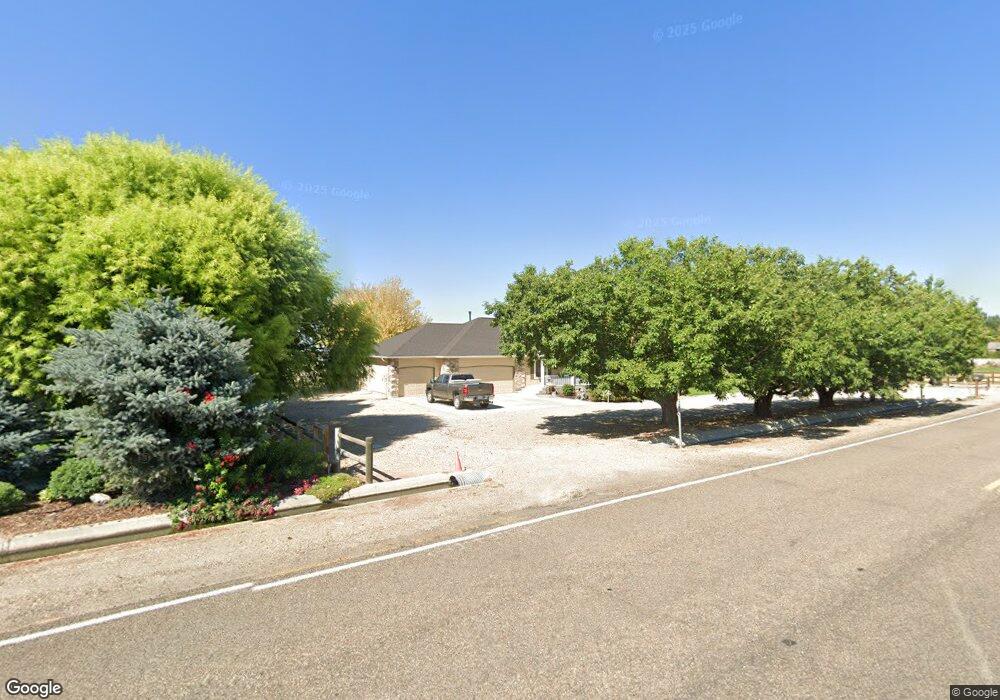
This home is located at 6650 Cherry Ln, Nampa, ID 83687 and is currently estimated at $733,280, approximately $321 per square foot. 6650 Cherry Ln is a home located in Canyon County with nearby schools including East Canyon Elementary School, Sage Valley Middle School, and Ridgevue High School.
Ownership History
Date
Name
Owned For
Owner Type
Purchase Details
Closed on
Aug 10, 2023
Sold by
Lough Asa James
Bought by
Lough Asa James and Lough Debbie L
Current Estimated Value
Purchase Details
Closed on
Sep 28, 2020
Sold by
Lough Asa Jams and Lough Debbie L
Bought by
Lough Asa James
Home Financials for this Owner
Home Financials are based on the most recent Mortgage that was taken out on this home.
Original Mortgage
$50,000
Interest Rate
2.9%
Mortgage Type
Credit Line Revolving
Create a Home Valuation Report for This Property
The Home Valuation Report is an in-depth analysis detailing your home's value as well as a comparison with similar homes in the area
Home Values in the Area
Average Home Value in this Area
Purchase History
| Date | Buyer | Sale Price | Title Company |
|---|---|---|---|
| Lough Asa James | -- | Alliance Title | |
| Lough Asa James | -- | Pioneer Title Canyon |
Source: Public Records
Mortgage History
| Date | Status | Borrower | Loan Amount |
|---|---|---|---|
| Previous Owner | Lough Asa James | $50,000 |
Source: Public Records
Tax History Compared to Growth
Tax History
| Year | Tax Paid | Tax Assessment Tax Assessment Total Assessment is a certain percentage of the fair market value that is determined by local assessors to be the total taxable value of land and additions on the property. | Land | Improvement |
|---|---|---|---|---|
| 2025 | $2,729 | $719,600 | $287,700 | $431,900 |
| 2024 | $2,729 | $683,600 | $258,900 | $424,700 |
| 2023 | $2,780 | $702,000 | $258,900 | $443,100 |
| 2022 | $3,315 | $746,290 | $300,990 | $445,300 |
| 2021 | $3,505 | $536,420 | $178,420 | $358,000 |
| 2020 | $3,443 | $432,520 | $132,920 | $299,600 |
| 2019 | $3,796 | $427,320 | $122,920 | $304,400 |
| 2018 | $3,597 | $0 | $0 | $0 |
| 2017 | $3,291 | $0 | $0 | $0 |
| 2016 | $2,920 | $0 | $0 | $0 |
| 2015 | $2,706 | $0 | $0 | $0 |
| 2014 | $2,611 | $269,500 | $75,100 | $194,400 |
Source: Public Records
Map
Nearby Homes
- 16899 N Lowerfield Loop
- 16912 N Chelford Loop
- 16956 N Chelford Loop
- 6346 E Monroe St
- 16928 N Chelford Loop
- 16603 N Fielding Way
- 6624 E Harrington Dr
- 6238 E Canyon Crossing Dr
- 16442 N Putting Ct
- 6803 E Greens Dr
- 7151 E Canterbury Ln
- 7236 Cherry Ln
- 17540 11th Ave N
- 17276 11th Ave N
- 6945 E Greens Dr
- 16548 N Yorkshire Ln
- 6975 E Greens Dr
- 7312 E Wiltshire Ln
- 7238 E Shields Dr
- 7119 Birch Ln
- 6666 Cherry Ln
- 6640 Cherry Ln
- 6626 E Thornton St
- 6610 E Thornton St
- 6698 Cherry Ln
- 6594 E Thornton St
- 6658 E Thornton St
- 6564 Cherry Ln
- 6578 E Thornton St
- 6674 E Thornton St
- 6641 E Thornton St
- 6562 E Thornton St
- 6625 E Thornton St
- 6609 E Thornton St
- 6690 E Thornton St
- 6548 E Fairmount St
- 6657 E Thornton St
- 6593 E Thornton St
- 6673 E Thornton St
- 6546 E Thornton St