6651 Whistling Swan Way Las Vegas, NV 89118
Estimated Value: $391,079 - $406,000
3
Beds
3
Baths
1,573
Sq Ft
$253/Sq Ft
Est. Value
About This Home
This home is located at 6651 Whistling Swan Way, Las Vegas, NV 89118 and is currently estimated at $398,270, approximately $253 per square foot. 6651 Whistling Swan Way is a home located in Clark County with nearby schools including Marion B Earl Elementary School, Grant Sawyer Middle School, and Durango High School.
Ownership History
Date
Name
Owned For
Owner Type
Purchase Details
Closed on
Jan 26, 2012
Sold by
Frisk Timothy A
Bought by
Frisk Timothy A and Timothy A Frisk Living Trust
Current Estimated Value
Purchase Details
Closed on
Apr 2, 1999
Sold by
Sze Wing and Ping Li Y
Bought by
Frish Timothy A
Home Financials for this Owner
Home Financials are based on the most recent Mortgage that was taken out on this home.
Original Mortgage
$118,817
Outstanding Balance
$30,087
Interest Rate
7.04%
Mortgage Type
FHA
Estimated Equity
$368,183
Purchase Details
Closed on
Mar 18, 1997
Sold by
Environment For Living Inc
Bought by
Sze Wing and Li Ping Y
Home Financials for this Owner
Home Financials are based on the most recent Mortgage that was taken out on this home.
Original Mortgage
$98,350
Interest Rate
7.74%
Create a Home Valuation Report for This Property
The Home Valuation Report is an in-depth analysis detailing your home's value as well as a comparison with similar homes in the area
Home Values in the Area
Average Home Value in this Area
Purchase History
| Date | Buyer | Sale Price | Title Company |
|---|---|---|---|
| Frisk Timothy A | -- | None Available | |
| Frish Timothy A | $119,000 | Fidelity National Title Agen | |
| Sze Wing | $125,000 | Lawyers Title |
Source: Public Records
Mortgage History
| Date | Status | Borrower | Loan Amount |
|---|---|---|---|
| Open | Frish Timothy A | $118,817 | |
| Previous Owner | Sze Wing | $98,350 |
Source: Public Records
Tax History Compared to Growth
Tax History
| Year | Tax Paid | Tax Assessment Tax Assessment Total Assessment is a certain percentage of the fair market value that is determined by local assessors to be the total taxable value of land and additions on the property. | Land | Improvement |
|---|---|---|---|---|
| 2025 | $1,661 | $85,585 | $30,800 | $54,785 |
| 2024 | $1,613 | $85,585 | $30,800 | $54,785 |
| 2023 | $1,613 | $78,393 | $26,250 | $52,143 |
| 2022 | $1,567 | $70,825 | $23,100 | $47,725 |
| 2021 | $1,521 | $67,915 | $22,400 | $45,515 |
| 2020 | $1,474 | $63,760 | $18,550 | $45,210 |
| 2019 | $1,431 | $62,749 | $18,200 | $44,549 |
| 2018 | $1,389 | $57,845 | $15,050 | $42,795 |
| 2017 | $1,684 | $57,213 | $14,000 | $43,213 |
| 2016 | $1,316 | $56,249 | $9,800 | $46,449 |
| 2015 | $1,313 | $45,876 | $7,000 | $38,876 |
| 2014 | $1,274 | $41,959 | $7,000 | $34,959 |
Source: Public Records
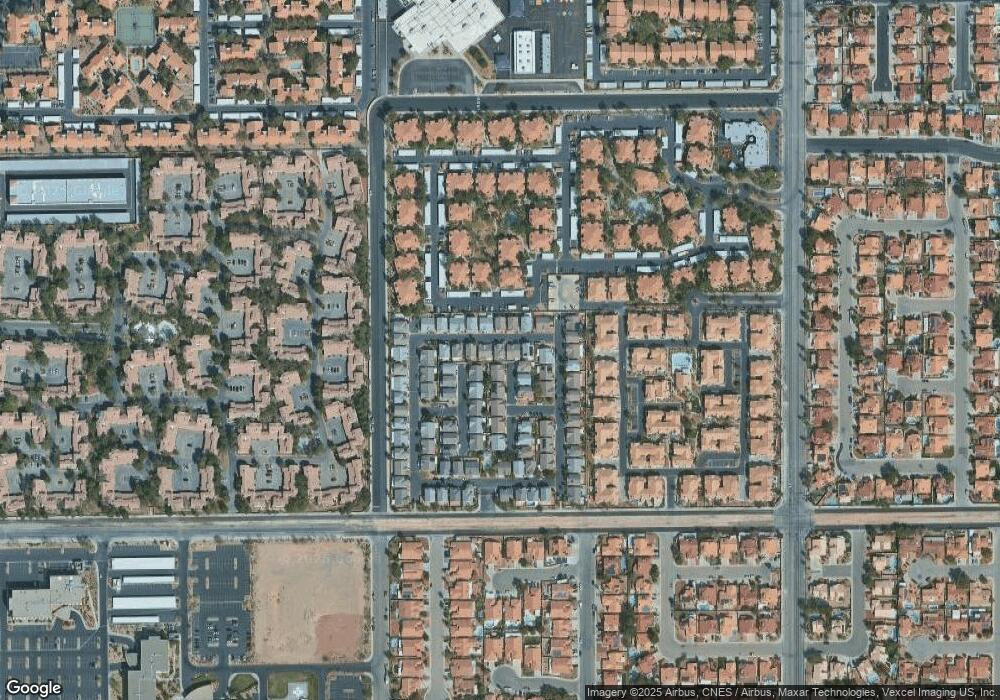
Map
Nearby Homes
- 5236 Ladyhawk Way
- 5212 Shasta Lake Way
- 5263 Shasta Lake Way
- 5201 S Torrey Pines Dr Unit 1227
- 5201 S Torrey Pines Dr Unit 1253
- 5255 Autumn Sky Rd
- 5263 Autumn Sky Rd
- 5052 S Rainbow Blvd Unit 201
- 5250 S Rainbow Blvd Unit 1075
- 5250 S Rainbow Blvd Unit 1132
- 5250 S Rainbow Blvd Unit 1123
- 5250 S Rainbow Blvd Unit 2138
- 5250 S Rainbow Blvd Unit 2003
- 5250 S Rainbow Blvd Unit 1010
- 5250 S Rainbow Blvd Unit 2108
- 5250 S Rainbow Blvd Unit 2184
- 5250 S Rainbow Blvd Unit 2080
- 5250 S Rainbow Blvd Unit 2104
- 5250 S Rainbow Blvd Unit 2110
- 5250 S Rainbow Blvd Unit 2002
- 6659 Whistling Swan Way
- 6659 Whistling Swan Way Unit n/a
- 6643 Whistling Swan Way
- 5227 Fighting Fish Way
- 6652 Whistling Swan Way
- 6660 Whistling Swan Way
- 6667 Whistling Swan Way
- 6635 Whistling Swan Way
- 6644 Whistling Swan Way
- 5224 Fighting Fish Way
- 5228 Ladyhawk Way
- 6668 Whistling Swan Way
- 6636 Whistling Swan Way
- 5232 Fighting Fish Way
- 5235 Fighting Fish Way
- 6675 Whistling Swan Way
- 5221 Shasta Lake Way
- 6676 Whistling Swan Way
- 5229 Shasta Lake Way
- 6628 Whistling Swan Way