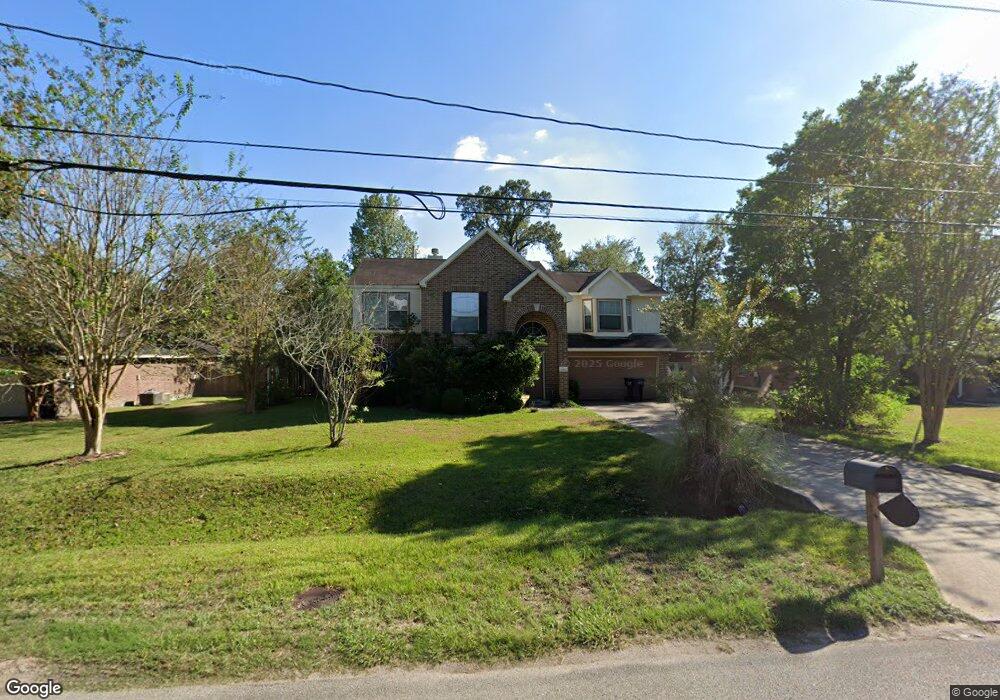
6651 Woodland Oaks Magnolia, TX 77354
Estimated Value: $341,916 - $410,000
4
Beds
3
Baths
2,495
Sq Ft
$146/Sq Ft
Est. Value
About This Home
This home is located at 6651 Woodland Oaks, Magnolia, TX 77354 and is currently estimated at $365,229, approximately $146 per square foot. 6651 Woodland Oaks is a home located in Montgomery County with nearby schools including Tom R. Ellisor Elementary School, Bear Branch Junior High School, and Magnolia High School.
Ownership History
Date
Name
Owned For
Owner Type
Purchase Details
Closed on
Feb 27, 2013
Sold by
Ostlund Nicola and Ostlund Nicola
Bought by
Tull Blake
Current Estimated Value
Home Financials for this Owner
Home Financials are based on the most recent Mortgage that was taken out on this home.
Original Mortgage
$161,519
Outstanding Balance
$112,985
Interest Rate
3.5%
Mortgage Type
FHA
Estimated Equity
$252,244
Purchase Details
Closed on
Aug 12, 2005
Sold by
Royce Homes Lp
Bought by
Ostlund Paul and Ostlund Nicola
Home Financials for this Owner
Home Financials are based on the most recent Mortgage that was taken out on this home.
Original Mortgage
$120,800
Interest Rate
5.65%
Mortgage Type
Fannie Mae Freddie Mac
Purchase Details
Closed on
May 14, 2002
Sold by
Stoecker Corporation
Bought by
Tull Blake
Create a Home Valuation Report for This Property
The Home Valuation Report is an in-depth analysis detailing your home's value as well as a comparison with similar homes in the area
Home Values in the Area
Average Home Value in this Area
Purchase History
| Date | Buyer | Sale Price | Title Company |
|---|---|---|---|
| Tull Blake | -- | Stewart Tile Of Montgomery C | |
| Ostlund Paul | -- | Stewart Title | |
| Tull Blake | -- | -- |
Source: Public Records
Mortgage History
| Date | Status | Borrower | Loan Amount |
|---|---|---|---|
| Open | Tull Blake | $161,519 | |
| Previous Owner | Ostlund Paul | $120,800 |
Source: Public Records
Tax History Compared to Growth
Tax History
| Year | Tax Paid | Tax Assessment Tax Assessment Total Assessment is a certain percentage of the fair market value that is determined by local assessors to be the total taxable value of land and additions on the property. | Land | Improvement |
|---|---|---|---|---|
| 2025 | $5,623 | $333,384 | $58,000 | $275,384 |
| 2024 | $5,663 | $355,192 | $58,000 | $297,192 |
| 2023 | $5,663 | $358,720 | $58,000 | $300,720 |
| 2022 | $5,769 | $326,930 | $45,900 | $281,030 |
| 2021 | $4,704 | $253,090 | $42,500 | $210,590 |
| 2020 | $5,121 | $253,030 | $36,000 | $217,030 |
| 2019 | $4,745 | $235,620 | $36,000 | $199,620 |
| 2018 | $4,645 | $219,730 | $12,360 | $207,370 |
| 2017 | $4,661 | $219,790 | $12,360 | $207,430 |
| 2016 | $4,654 | $219,460 | $12,360 | $207,100 |
| 2015 | $3,966 | $202,250 | $12,360 | $189,890 |
| 2014 | $3,966 | $184,930 | $12,360 | $172,570 |
Source: Public Records
Map
Nearby Homes
- 6910 Woodland Oaks
- 7002 Durango Creek Dr
- 723 Hinsdale
- 6846 Durango Creek Dr
- 6818 Woodland Oaks
- 6902 Woodland Oaks
- 6626 Grant Dr
- 6718 Durango Creek Dr
- 7010 Durango Dr
- 6906 Grant Dr
- 6706 Durango Creek Dr
- 7203 Cool Springs Ct
- 906 Wiley Dr
- 7119 Durango Dr
- 7455 Durango Creek Dr
- 7215 Autumn Day Ct
- 7022 Dillon Dr
- 33127 Cottonwood Bend
- 247 Brazen Forest Trail
- 222 Brazen Forest Trail
- 6647 Woodland Oaks
- 6703 Woodland Oaks
- 100 Woodland Oaks
- 6707 Woodland Oaks
- 7006 Casita Dr
- 7002 Casita Dr
- 6643 Woodland Oaks
- 802 Gunnison
- 7010 Casita Dr
- 6711 Woodland Oaks
- 6702 Woodland Oaks
- 7003 Casita Dr
- 6639 Woodland Oaks
- 6715 Woodland Oaks
- 7014 Casita Dr
- 7018 Casita Dr
- 7007 Casita Dr
- 7011 Casita Dr
- 803 Hinsdale
- 7022 Casita Dr