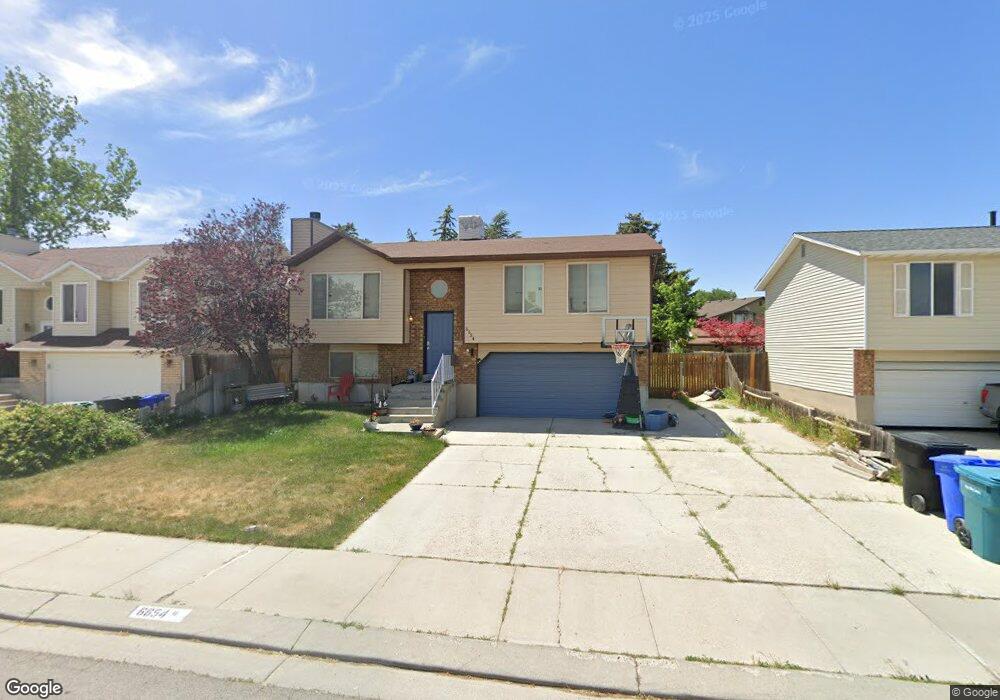
6654 Lotus Way West Jordan, UT 84081
Oquirrh NeighborhoodEstimated Value: $420,000 - $464,000
3
Beds
2
Baths
938
Sq Ft
$471/Sq Ft
Est. Value
About This Home
This home is located at 6654 Lotus Way, West Jordan, UT 84081 and is currently estimated at $441,439, approximately $470 per square foot. 6654 Lotus Way is a home located in Salt Lake County with nearby schools including Mountain Shadows School, West Hills Middle School, and Copper Hills High School.
Ownership History
Date
Name
Owned For
Owner Type
Purchase Details
Closed on
Apr 12, 2019
Sold by
Myers Tammy
Bought by
Myers Tammy
Current Estimated Value
Home Financials for this Owner
Home Financials are based on the most recent Mortgage that was taken out on this home.
Original Mortgage
$208,000
Outstanding Balance
$183,237
Interest Rate
4.4%
Mortgage Type
New Conventional
Estimated Equity
$258,202
Purchase Details
Closed on
Mar 22, 2011
Sold by
Myers Jason and Myers Tammy
Bought by
Myers Tammy
Home Financials for this Owner
Home Financials are based on the most recent Mortgage that was taken out on this home.
Original Mortgage
$138,500
Interest Rate
4.45%
Mortgage Type
New Conventional
Purchase Details
Closed on
Apr 25, 2002
Sold by
Warenski Shawn R and Warenski Tamara
Bought by
Myers Jason and Myers Tammy
Home Financials for this Owner
Home Financials are based on the most recent Mortgage that was taken out on this home.
Original Mortgage
$128,779
Interest Rate
7.08%
Mortgage Type
FHA
Create a Home Valuation Report for This Property
The Home Valuation Report is an in-depth analysis detailing your home's value as well as a comparison with similar homes in the area
Home Values in the Area
Average Home Value in this Area
Purchase History
| Date | Buyer | Sale Price | Title Company |
|---|---|---|---|
| Myers Tammy | -- | Meridian Title | |
| Myers Tammy | -- | Accommodation | |
| Myers Jason | -- | Superior Title Company |
Source: Public Records
Mortgage History
| Date | Status | Borrower | Loan Amount |
|---|---|---|---|
| Open | Myers Tammy | $208,000 | |
| Closed | Myers Tammy | $138,500 | |
| Closed | Myers Jason | $128,779 |
Source: Public Records
Tax History Compared to Growth
Tax History
| Year | Tax Paid | Tax Assessment Tax Assessment Total Assessment is a certain percentage of the fair market value that is determined by local assessors to be the total taxable value of land and additions on the property. | Land | Improvement |
|---|---|---|---|---|
| 2025 | $2,234 | $395,700 | $100,400 | $295,300 |
| 2024 | $2,234 | $377,700 | $94,700 | $283,000 |
| 2023 | $2,231 | $354,300 | $91,000 | $263,300 |
| 2022 | $2,176 | $343,500 | $89,300 | $254,200 |
| 2021 | $1,906 | $279,400 | $68,700 | $210,700 |
| 2020 | $1,790 | $245,000 | $68,700 | $176,300 |
| 2019 | $1,739 | $233,300 | $64,800 | $168,500 |
| 2018 | $0 | $214,600 | $64,800 | $149,800 |
| 2017 | $1,469 | $191,300 | $64,800 | $126,500 |
| 2016 | $1,437 | $176,000 | $64,800 | $111,200 |
| 2015 | $1,299 | $153,500 | $62,000 | $91,500 |
| 2014 | $1,270 | $147,400 | $60,100 | $87,300 |
Source: Public Records
Map
Nearby Homes
- 5557 W Joshua Cir
- 6739 S Sol Rise Dr
- 5466 Ticklegrass Rd
- 6721 Adventure Way
- 5732 W Moon Crest Ct
- 6853 Mullien Dr Unit 5420
- 6922 Mullien Dr
- 6839 S Cyclamen Dr
- 7758 S Iron Core Ln
- 7146 W Owens View Way Unit 204
- 7259 W Cibola Rd
- 5502 Starflower Way
- 5281 Saguaro Dr
- 5198 Crus Corvi Rd
- 5183 W Cadenza Dr
- 6568 S 5180 W
- 5271 W Begonia Cir
- 7043 S Orion Hill Rd
- 6977 W Hidden Way S Unit 147
- 6312 S Cosmo Dr
- 6664 Lotus Way
- 6664 S Lotus Way
- 6646 Lotus Way
- 6659 Golden Gate Cir
- 6672 S Lotus Way
- 6672 Lotus Way
- 6647 Golden Gate Cir
- 6655 S Lotus Way
- 6655 Lotus Way
- 6661 S Golden Gate Cir
- 6665 S Lotus Way
- 6665 Lotus Way
- 6647 Lotus Way
- 6661 Golden Gate Cir
- 6680 Lotus Way
- 6673 Lotus Way
- 5544 W Golden Gate Cir
- 5544 Golden Gate Cir
- 5550 W Golden Gate Cir
- 5550 Golden Gate Cir