6654 Lyceum Ct Cincinnati, OH 45230
Mount Washington NeighborhoodEstimated Value: $318,000 - $380,205
3
Beds
4
Baths
1,519
Sq Ft
$223/Sq Ft
Est. Value
About This Home
This home is located at 6654 Lyceum Ct, Cincinnati, OH 45230 and is currently estimated at $338,801, approximately $223 per square foot. 6654 Lyceum Ct is a home with nearby schools including Mt. Washington Elementary School, Clark Montessori High School, and Shroder High School.
Ownership History
Date
Name
Owned For
Owner Type
Purchase Details
Closed on
Dec 7, 1999
Sold by
Melaleuca Inc
Bought by
Omeara Mardee R
Current Estimated Value
Home Financials for this Owner
Home Financials are based on the most recent Mortgage that was taken out on this home.
Original Mortgage
$123,100
Outstanding Balance
$36,398
Interest Rate
8.02%
Estimated Equity
$302,403
Purchase Details
Closed on
Nov 5, 1999
Sold by
Whitler Kimberly A
Bought by
Melaleuca Inc
Home Financials for this Owner
Home Financials are based on the most recent Mortgage that was taken out on this home.
Original Mortgage
$123,100
Outstanding Balance
$36,398
Interest Rate
8.02%
Estimated Equity
$302,403
Purchase Details
Closed on
Nov 13, 1997
Sold by
Dyehouse Janice M
Bought by
Whitler Kimberly A
Home Financials for this Owner
Home Financials are based on the most recent Mortgage that was taken out on this home.
Original Mortgage
$107,200
Interest Rate
7.43%
Create a Home Valuation Report for This Property
The Home Valuation Report is an in-depth analysis detailing your home's value as well as a comparison with similar homes in the area
Home Values in the Area
Average Home Value in this Area
Purchase History
| Date | Buyer | Sale Price | Title Company |
|---|---|---|---|
| Omeara Mardee R | $153,900 | L & D Title Agency Inc | |
| Melaleuca Inc | $150,300 | -- | |
| Whitler Kimberly A | $134,000 | -- |
Source: Public Records
Mortgage History
| Date | Status | Borrower | Loan Amount |
|---|---|---|---|
| Open | Omeara Mardee R | $123,100 | |
| Previous Owner | Whitler Kimberly A | $107,200 |
Source: Public Records
Tax History
| Year | Tax Paid | Tax Assessment Tax Assessment Total Assessment is a certain percentage of the fair market value that is determined by local assessors to be the total taxable value of land and additions on the property. | Land | Improvement |
|---|---|---|---|---|
| 2025 | $4,079 | $76,594 | $14,000 | $62,594 |
| 2024 | $3,958 | $76,594 | $14,000 | $62,594 |
| 2023 | $4,099 | $76,594 | $14,000 | $62,594 |
| 2022 | $3,804 | $64,866 | $13,860 | $51,006 |
| 2021 | $3,652 | $64,866 | $13,860 | $51,006 |
| 2020 | $3,775 | $64,866 | $13,860 | $51,006 |
| 2019 | $3,689 | $58,968 | $12,600 | $46,368 |
| 2018 | $3,695 | $58,968 | $12,600 | $46,368 |
| 2017 | $3,502 | $58,968 | $12,600 | $46,368 |
| 2016 | $3,198 | $54,086 | $12,373 | $41,713 |
| 2015 | $2,889 | $54,086 | $12,373 | $41,713 |
| 2014 | $2,911 | $54,086 | $12,373 | $41,713 |
| 2013 | $2,927 | $53,550 | $12,250 | $41,300 |
Source: Public Records
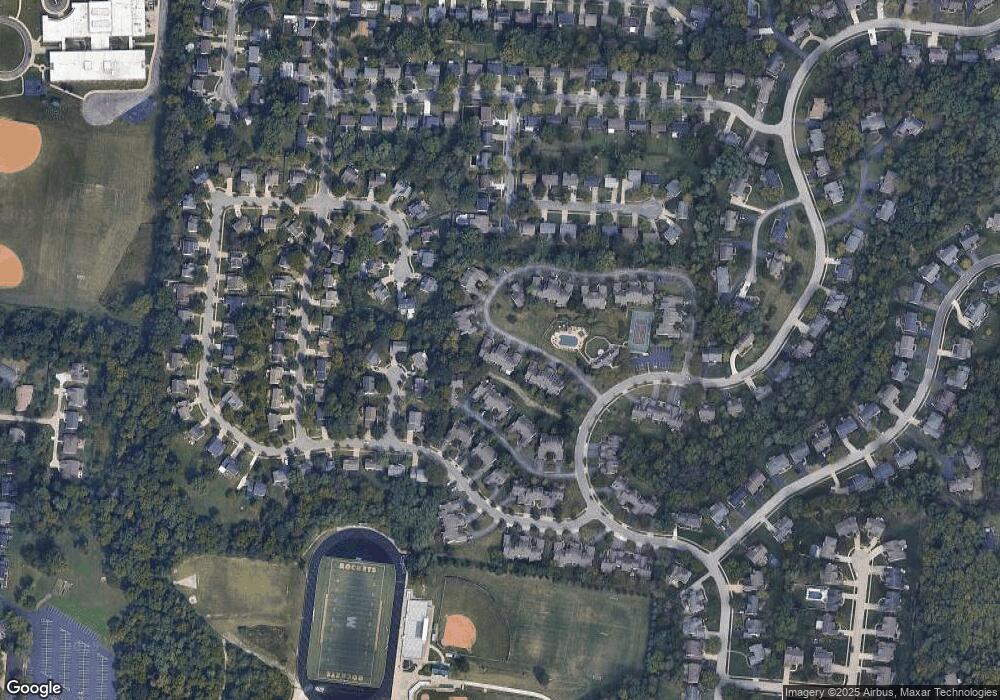
Map
Nearby Homes
- 2140 Trailwood Dr
- 1939 Lady Ellen Dr
- 6542 Rainbow Ln
- 2133 Ronaldson Ave
- 2412 Findlater Ct
- 6604 Ambar Ave
- 1627 Alcor Terrace
- 6253 Sturdy Ave
- 1944 Rockland Ave
- 7061 Clough Pike
- 6519 Copperleaf Ln
- 1741 Mears Ave
- 6122 Corbly Rd
- 1454 Antoinette Ave
- 2121 Sutton Ave
- 2111 Sutton Ave
- 2241 Spinningwheel Ln
- 6050 Colter Ave
- 6123 Cambridge Ave
- 1361 Bursal Ave
- 6664 Lyceum Ct
- 6650 Lyceum Ct
- 6670 Lyceum Ct
- 6639 Conlan Ct
- 6640 Lyceum Ct
- 6674 Lyceum Ct
- 6641 Conlan Ct
- 6645 Conlan Ct
- 6630 Lyceum Ct
- 6631 Conlan Ct
- 6605 Lyceum Ct
- 6649 Conlan Ct
- 6686 Lyceum Ct
- 2080 Autumn Hill Ct
- 6620 Lyceum Ct
- 6651 Conlan Ct
- 6589 Lyceum Ct
- 2070 Autumn Hill Ct
- 6575 Lyceum Ct
- 6610 Lyceum Ct
Your Personal Tour Guide
Ask me questions while you tour the home.