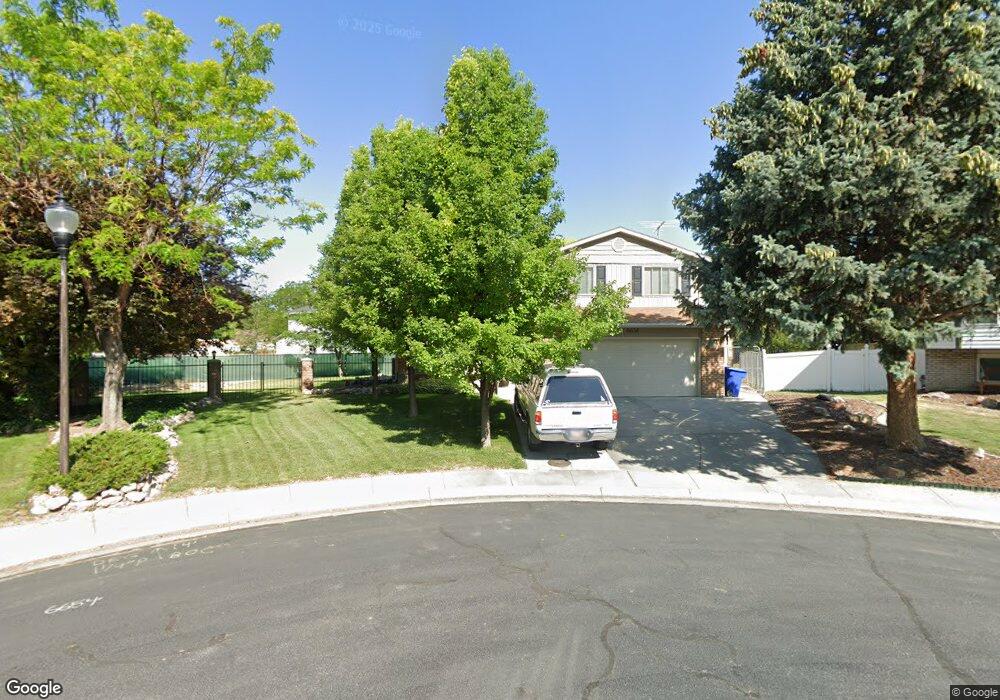
6654 S 3235 W West Jordan, UT 84084
Estimated Value: $512,672 - $543,000
3
Beds
1
Bath
1,429
Sq Ft
$365/Sq Ft
Est. Value
About This Home
This home is located at 6654 S 3235 W, West Jordan, UT 84084 and is currently estimated at $521,418, approximately $364 per square foot. 6654 S 3235 W is a home located in Salt Lake County with nearby schools including West Jordan Middle School, West Jordan High School, and Learning Tree School - Southwest.
Ownership History
Date
Name
Owned For
Owner Type
Purchase Details
Closed on
Nov 21, 2019
Sold by
Cooper Michael K and Cooper Jayne M
Bought by
Cooper Michael K and Cooper Melissa Jayne
Current Estimated Value
Home Financials for this Owner
Home Financials are based on the most recent Mortgage that was taken out on this home.
Original Mortgage
$172,000
Outstanding Balance
$79,025
Interest Rate
3.5%
Estimated Equity
$442,393
Purchase Details
Closed on
Jul 20, 1995
Sold by
Cooper Michael K and Cooper Jayne
Bought by
Cooper Michael K and Cooper Jayne M
Home Financials for this Owner
Home Financials are based on the most recent Mortgage that was taken out on this home.
Original Mortgage
$100,500
Interest Rate
7.62%
Create a Home Valuation Report for This Property
The Home Valuation Report is an in-depth analysis detailing your home's value as well as a comparison with similar homes in the area
Home Values in the Area
Average Home Value in this Area
Purchase History
| Date | Buyer | Sale Price | Title Company |
|---|---|---|---|
| Cooper Michael K | -- | Title One | |
| Cooper Michael K | -- | -- |
Source: Public Records
Mortgage History
| Date | Status | Borrower | Loan Amount |
|---|---|---|---|
| Open | Cooper Michael K | $172,000 | |
| Previous Owner | Cooper Michael K | $100,500 |
Source: Public Records
Tax History Compared to Growth
Tax History
| Year | Tax Paid | Tax Assessment Tax Assessment Total Assessment is a certain percentage of the fair market value that is determined by local assessors to be the total taxable value of land and additions on the property. | Land | Improvement |
|---|---|---|---|---|
| 2025 | $235 | $453,500 | $171,000 | $282,500 |
| 2024 | $235 | $434,600 | $163,800 | $270,800 |
| 2023 | $2,286 | $414,500 | $154,500 | $260,000 |
| 2022 | $492 | $403,900 | $151,500 | $252,400 |
| 2021 | $1,546 | $317,400 | $116,200 | $201,200 |
| 2020 | $1,016 | $281,100 | $116,200 | $164,900 |
| 2019 | $945 | $275,800 | $90,900 | $184,900 |
| 2018 | $459 | $255,000 | $87,800 | $167,200 |
| 2017 | $136 | $220,100 | $87,800 | $132,300 |
| 2016 | $1,433 | $198,700 | $87,800 | $110,900 |
| 2015 | $1,308 | $176,800 | $87,000 | $89,800 |
| 2014 | $1,283 | $170,800 | $85,300 | $85,500 |
Source: Public Records
Map
Nearby Homes
- 6672 S 3335 W
- 6453 Fremont Peak Cir
- 3226 Tysonbrook Ct
- 6512 Timpanogos Way
- 6893 S 3200 W
- 3305 W Kingsbrook Ave
- 3383 W 6880 S
- 6482 S Gold Medal Dr
- 3052 W Matterhorn Dr
- 3538 W Biathlon Cir
- 3537 W Green Springs Ln
- 8524 S Michele River Ave W Unit 109
- 3660 Ashland Cir
- 6863 S Dixie Dr
- 2683 W Carson Ln
- 1824 W 6200 S
- 6968 S 3535 W Unit 3
- 6222 S Westbrook Dr
- 6980 S 3535 W Unit 2
- 3695 Carolina Dr