Estimated Value: $183,965 - $214,000
3
Beds
1
Bath
1,067
Sq Ft
$185/Sq Ft
Est. Value
About This Home
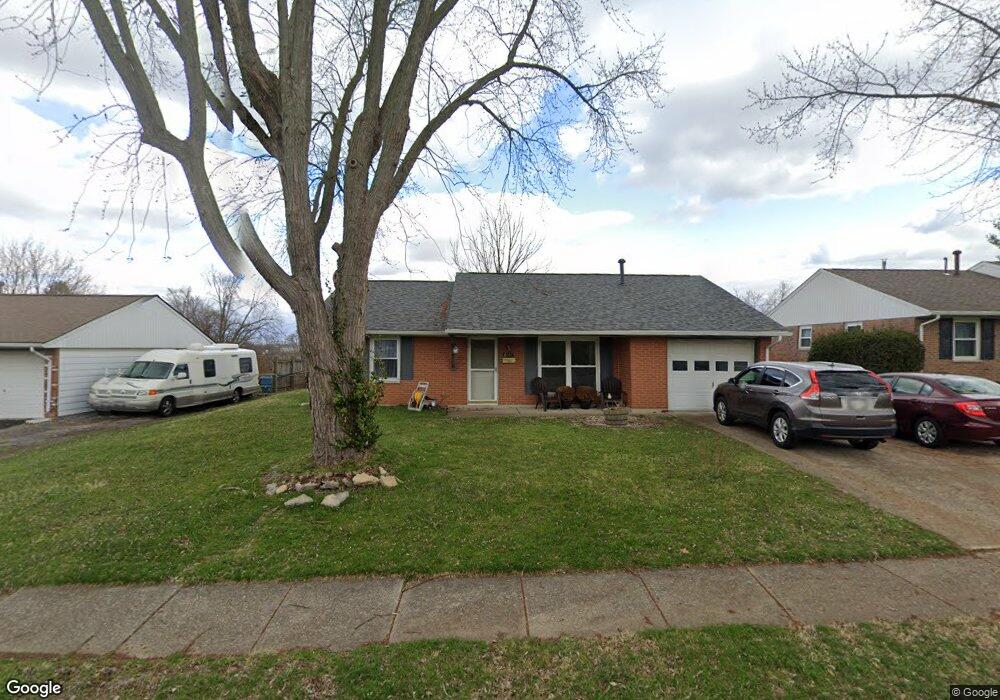
This home is located at 6656 Emerald Ave, Enon, OH 45323 and is currently estimated at $197,491, approximately $185 per square foot. 6656 Emerald Ave is a home located in Clark County with nearby schools including Greenon Elementary School, Greenon Jr. High School, and Greenon High School.
Ownership History
Date
Name
Owned For
Owner Type
Purchase Details
Closed on
Dec 16, 2019
Sold by
Johnson Karel L and Johnson Joel R
Bought by
Amonds Emily B
Current Estimated Value
Home Financials for this Owner
Home Financials are based on the most recent Mortgage that was taken out on this home.
Original Mortgage
$98,090
Outstanding Balance
$85,919
Interest Rate
3.6%
Mortgage Type
FHA
Estimated Equity
$111,572
Purchase Details
Closed on
Jan 22, 2007
Sold by
Johnson Karel L and Johnson Joel R
Bought by
Johnson Joel R and Johnson Karel L
Purchase Details
Closed on
Aug 15, 1994
Sold by
Laino Antonio
Bought by
Makley Karel L
Home Financials for this Owner
Home Financials are based on the most recent Mortgage that was taken out on this home.
Original Mortgage
$69,780
Interest Rate
8%
Mortgage Type
New Conventional
Purchase Details
Closed on
Dec 29, 1986
Create a Home Valuation Report for This Property
The Home Valuation Report is an in-depth analysis detailing your home's value as well as a comparison with similar homes in the area
Home Values in the Area
Average Home Value in this Area
Purchase History
We collect this data history from publicly available records. To have your information removed, we recommend requesting removal directly through your county’s website.
| Date | Buyer | Sale Price | Title Company |
|---|---|---|---|
| Amonds Emily B | $99,900 | Landmark Title Agency South | |
| Johnson Joel R | -- | Pacific Title Agency | |
| Makley Karel L | $69,500 | -- | |
| -- | $41,000 | -- |
Source: Public Records
Mortgage History
We collect this data history from publicly available records. To have your information removed, we recommend requesting removal directly through your county’s website.
| Date | Status | Borrower | Loan Amount |
|---|---|---|---|
| Open | Amonds Emily B | $98,090 | |
| Previous Owner | Makley Karel L | $69,780 |
Source: Public Records
Tax History
| Year | Tax Paid | Tax Assessment Tax Assessment Total Assessment is a certain percentage of the fair market value that is determined by local assessors to be the total taxable value of land and additions on the property. | Land | Improvement |
|---|---|---|---|---|
| 2025 | $2,039 | $54,800 | $11,790 | $43,010 |
| 2024 | $1,991 | $37,710 | $9,320 | $28,390 |
| 2023 | $1,991 | $37,710 | $9,320 | $28,390 |
| 2022 | $1,989 | $37,710 | $9,320 | $28,390 |
| 2021 | $2,014 | $33,740 | $6,910 | $26,830 |
| 2020 | $2,020 | $33,740 | $6,910 | $26,830 |
| 2019 | $2,047 | $33,740 | $6,910 | $26,830 |
| 2018 | $1,781 | $29,030 | $7,540 | $21,490 |
| 2017 | $1,804 | $26,730 | $7,536 | $19,194 |
| 2016 | $1,575 | $26,730 | $7,536 | $19,194 |
| 2015 | $1,494 | $25,806 | $7,536 | $18,270 |
| 2014 | $1,480 | $25,806 | $7,536 | $18,270 |
| 2013 | $1,316 | $25,806 | $7,536 | $18,270 |
Source: Public Records
Map
Nearby Homes
- 4024 Raymond Dr
- 440 S Xenia Dr
- 181 E Main St
- 141 N Xenia Dr
- 700 Ionic Cir
- 303 E Main St
- 2151 Willow Run Cir Unit 2151
- 2133 Willow Run Cir Unit 2133
- 144 Matthews Ave
- 250 Sunnybrook Trail
- 7026 Creekside Cir
- 7049 Creekside Cir
- 5463 Enon-Xenia Rd
- 4600 Snider Rd
- 0 Enon-Xenia Rd
- 6 Danzig Ln
- 5223 Hahn Ave
- 5127 Melvina St
- 0 Enon Xenia Rd
- 2693 Ehrhart Dr
- 6644 Emerald Ave
- 6668 Emerald Ave
- 6634 Emerald Ave
- 3855 Sparkhill Dr
- 6673 Emerald Ave
- 6622 Emerald Ave
- 6675 Emerald Ave
- 3873 Sparkhill Dr
- 6690 Emerald Ave
- 6654 Conway Dr
- 3860 Sparkhill Dr
- 6685 Emerald Ave
- 6648 Conway Dr
- 6610 Emerald Ave
- 3891 Sparkhill Dr
- 6693 Emerald Ave
- 6607 Emerald Ave
- 3886 Sparkhill Dr
- 6640 Conway Dr
- 3928 New York Dr
Your Personal Tour Guide
Ask me questions while you tour the home.