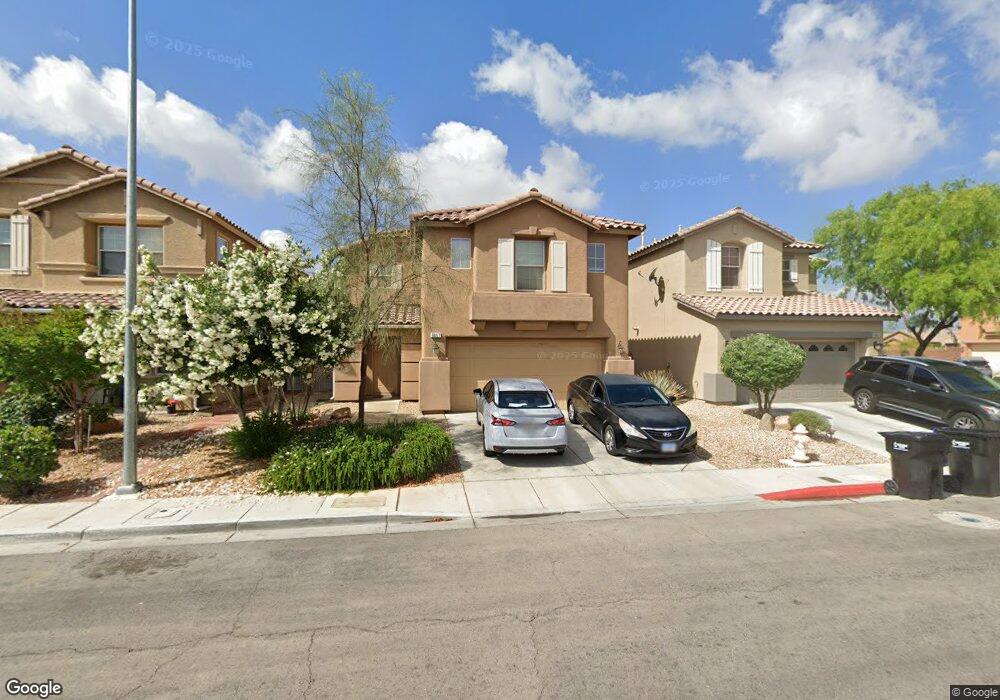
6657 Evening Grosbeak Place Unit 2 North Las Vegas, NV 89084
Aliante NeighborhoodEstimated Value: $429,535 - $453,000
3
Beds
3
Baths
2,205
Sq Ft
$200/Sq Ft
Est. Value
About This Home
This home is located at 6657 Evening Grosbeak Place Unit 2, North Las Vegas, NV 89084 and is currently estimated at $441,884, approximately $200 per square foot. 6657 Evening Grosbeak Place Unit 2 is a home located in Clark County with nearby schools including Vincent L. Triggs Elementary School, Anthony Saville Middle School, and Shadow Ridge High School.
Ownership History
Date
Name
Owned For
Owner Type
Purchase Details
Closed on
Nov 1, 2011
Sold by
Bank Of America Na
Bought by
First Savings Bank and Karen D Livingston Ira
Current Estimated Value
Purchase Details
Closed on
Jan 13, 2011
Sold by
Freeman Zianna
Bought by
Bac Home Loans Servicing Lp and Countrywide Home Loans Servicing Lp
Purchase Details
Closed on
Mar 17, 2006
Sold by
Freeman Joshua L
Bought by
Freeman Zianna Eve
Home Financials for this Owner
Home Financials are based on the most recent Mortgage that was taken out on this home.
Original Mortgage
$270,900
Interest Rate
6.37%
Create a Home Valuation Report for This Property
The Home Valuation Report is an in-depth analysis detailing your home's value as well as a comparison with similar homes in the area
Home Values in the Area
Average Home Value in this Area
Purchase History
| Date | Buyer | Sale Price | Title Company |
|---|---|---|---|
| First Savings Bank | $120,900 | Chicago Title Las Vegas | |
| Bac Home Loans Servicing Lp | $130,500 | Pasion Title Services | |
| Freeman Zianna Eve | -- | First Amer Title Co Of Nv | |
| Freeman Zianna | $338,686 | First Amer Title Co Of Nv |
Source: Public Records
Mortgage History
| Date | Status | Borrower | Loan Amount |
|---|---|---|---|
| Previous Owner | Freeman Zianna | $270,900 |
Source: Public Records
Tax History Compared to Growth
Tax History
| Year | Tax Paid | Tax Assessment Tax Assessment Total Assessment is a certain percentage of the fair market value that is determined by local assessors to be the total taxable value of land and additions on the property. | Land | Improvement |
|---|---|---|---|---|
| 2025 | $2,422 | $120,281 | $33,950 | $86,331 |
| 2024 | $2,244 | $120,281 | $33,950 | $86,331 |
| 2023 | $2,244 | $117,082 | $35,700 | $81,382 |
| 2022 | $2,078 | $103,227 | $29,050 | $74,177 |
| 2021 | $1,924 | $95,822 | $25,550 | $70,272 |
| 2020 | $1,784 | $94,778 | $25,200 | $69,578 |
| 2019 | $1,672 | $91,124 | $22,750 | $68,374 |
| 2018 | $1,595 | $78,172 | $17,500 | $60,672 |
| 2017 | $2,388 | $71,186 | $16,450 | $54,736 |
| 2016 | $1,494 | $60,834 | $12,250 | $48,584 |
| 2015 | $1,490 | $49,857 | $9,800 | $40,057 |
| 2014 | $1,444 | $41,759 | $7,000 | $34,759 |
Source: Public Records
Map
Nearby Homes
- 4037 Gliding Gulls Ave
- 6569 Cedar Waxwing St
- 6717 Divers Loons St
- 4233 Buteo Ln
- 4050 Midnight Crest Ave
- 3617 Indigo Flower St Unit 1
- 4145 Midnight Crest Ave
- 6334 Orions Belt Peak St
- 3521 Hazelnut Pine Place Unit 1
- 4413 Penguin Ave
- 3721 Alcantara Ln
- 6314 Ruby Cedar Ct
- 4221 Cackling Goose Dr
- 6437 Boatbill St
- 6736 Yellowwood Cove St
- 4610 Puglia Ln Unit 201
- 3624 Pelican Brief Ln
- 4625 Centisimo Dr Unit 202
- 6223 Orions Belt Peak St
- 4104 Fabulous Finches Ave
- 6653 Evening Grosbeak Place
- 6661 Evening Grosbeak Place
- 6649 Evening Grosbeak Place
- 6636 Pine Siskin Place
- 6632 Pine Siskin Place
- 6632 Pine Siskin Place
- 6632 Pine Siskin Place
- 6632 Pine Siskin Place
- 6640 Pine Siskin Place
- 6628 Pine Siskin Place
- 6644 Pine Siskin Place
- 6645 Evening Grosbeak Place
- 6652 Evening Grosbeak Place
- 6656 Evening Grosbeak Place
- 6624 Pine Siskin Place
- 6648 Evening Grosbeak Place
- 4124 Bird Man Ln
- 4120 Bird Man Ln
- 4116 Bird Man Ln
- 6641 Evening Grosbeak Place Unit 2