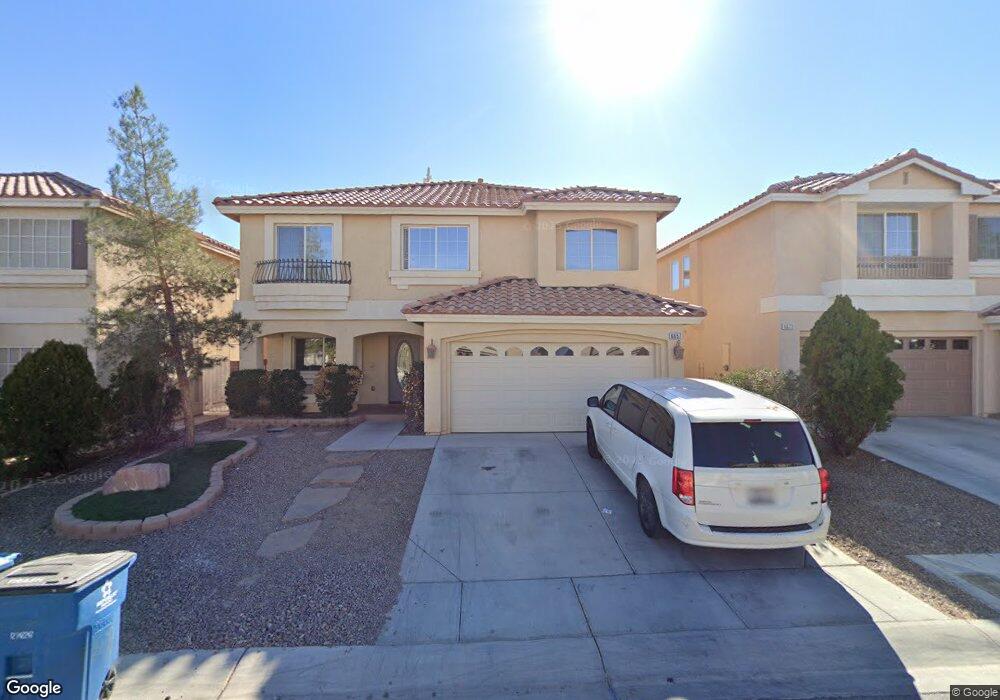
6657 Samba Ave Unit n/a Las Vegas, NV 89139
Coronado Ranch NeighborhoodEstimated Value: $525,248
4
Beds
3
Baths
2,226
Sq Ft
$236/Sq Ft
Est. Value
About This Home
This home is located at 6657 Samba Ave Unit n/a, Las Vegas, NV 89139 and is currently priced at $525,248, approximately $235 per square foot. 6657 Samba Ave Unit n/a is a home located in Clark County with nearby schools including Mark L Fine Elementary School, Lawrence & Heidi Canarelli Middle School, and Sierra Vista High School.
Ownership History
Date
Name
Owned For
Owner Type
Purchase Details
Closed on
Apr 16, 2012
Sold by
Citibank Na
Bought by
Xie Jianyang and Chen Linuan
Current Estimated Value
Purchase Details
Closed on
Mar 19, 2011
Sold by
Chang Xiao
Bought by
Citibank Na
Purchase Details
Closed on
Apr 20, 2005
Sold by
Ngal Peter B
Bought by
Chang Xiao
Home Financials for this Owner
Home Financials are based on the most recent Mortgage that was taken out on this home.
Original Mortgage
$399,700
Interest Rate
5.99%
Mortgage Type
Fannie Mae Freddie Mac
Purchase Details
Closed on
Apr 4, 2005
Sold by
Tradition Inc
Bought by
Chang Xiao
Home Financials for this Owner
Home Financials are based on the most recent Mortgage that was taken out on this home.
Original Mortgage
$399,700
Interest Rate
5.99%
Mortgage Type
Fannie Mae Freddie Mac
Create a Home Valuation Report for This Property
The Home Valuation Report is an in-depth analysis detailing your home's value as well as a comparison with similar homes in the area
Home Values in the Area
Average Home Value in this Area
Purchase History
| Date | Buyer | Sale Price | Title Company |
|---|---|---|---|
| Xie Jianyang | $168,000 | Fidelity Rainbow | |
| Citibank Na | $153,000 | Pasion Title Services | |
| Chang Xiao | -- | First Amer Title Co Of Nv | |
| Chang Xiao | $440,550 | First Amer Title Co Of Nv |
Source: Public Records
Mortgage History
| Date | Status | Borrower | Loan Amount |
|---|---|---|---|
| Previous Owner | Chang Xiao | $399,700 |
Source: Public Records
Tax History Compared to Growth
Tax History
| Year | Tax Paid | Tax Assessment Tax Assessment Total Assessment is a certain percentage of the fair market value that is determined by local assessors to be the total taxable value of land and additions on the property. | Land | Improvement |
|---|---|---|---|---|
| 2025 | $2,964 | $145,437 | $47,250 | $98,187 |
| 2024 | $2,745 | $145,437 | $47,250 | $98,187 |
| 2023 | $2,745 | $136,440 | $43,750 | $92,690 |
| 2022 | $2,542 | $119,525 | $35,000 | $84,525 |
| 2021 | $2,354 | $109,867 | $29,750 | $80,117 |
| 2020 | $2,183 | $108,877 | $29,750 | $79,127 |
| 2019 | $2,046 | $104,019 | $26,250 | $77,769 |
| 2018 | $1,952 | $97,050 | $22,400 | $74,650 |
| 2017 | $2,642 | $90,099 | $22,050 | $68,049 |
| 2016 | $1,828 | $76,570 | $15,750 | $60,820 |
| 2015 | $1,823 | $69,052 | $12,250 | $56,802 |
| 2014 | $1,767 | $58,448 | $10,500 | $47,948 |
Source: Public Records
Map
Nearby Homes
- 6609 Samba Ave
- 6745 Lydian Ct
- 6682 Metronome Ct
- 6507 Creekside Cellars Ct
- 6820 Pacific Echo Ct
- 6794 Medovina Ct
- 6465 Grande River Ct
- 6705 Philharmonic Ave
- 8276 Sorrel St
- 6785 Philharmonic Ave
- 6433 Brandon Hills Ct
- 6638 Melodic Ct
- 6403 Brandon Hills Ct
- 6682 Zorya Rise Ave
- 8525 Silver Coast St
- 8565 Silver Coast St
- 8543 Alpine Vineyards Ct
- 6877 Philharmonic Ave
- 6871 Treble Clef Ave
- 6313 Stag Hollow Ct
- 6657 Samba Ave
- 6649 Samba Ave
- 6673 Samba Ave
- 6641 Samba Ave
- 6675 Samba Ave
- 6681 Samba Ave
- 6633 Samba Ave
- 6652 Samba Ave
- 6672 Samba Ave
- 6672 Samba Ave Unit n/a
- 6648 Samba Ave
- 6674 Samba Ave Unit 6674
- 6674 Samba Ave Unit none
- 6674 Samba Ave
- 6640 Samba Ave
- 6625 Samba Ave
- 6680 Samba Ave
- 6632 Samba Ave
- 6617 Samba Ave