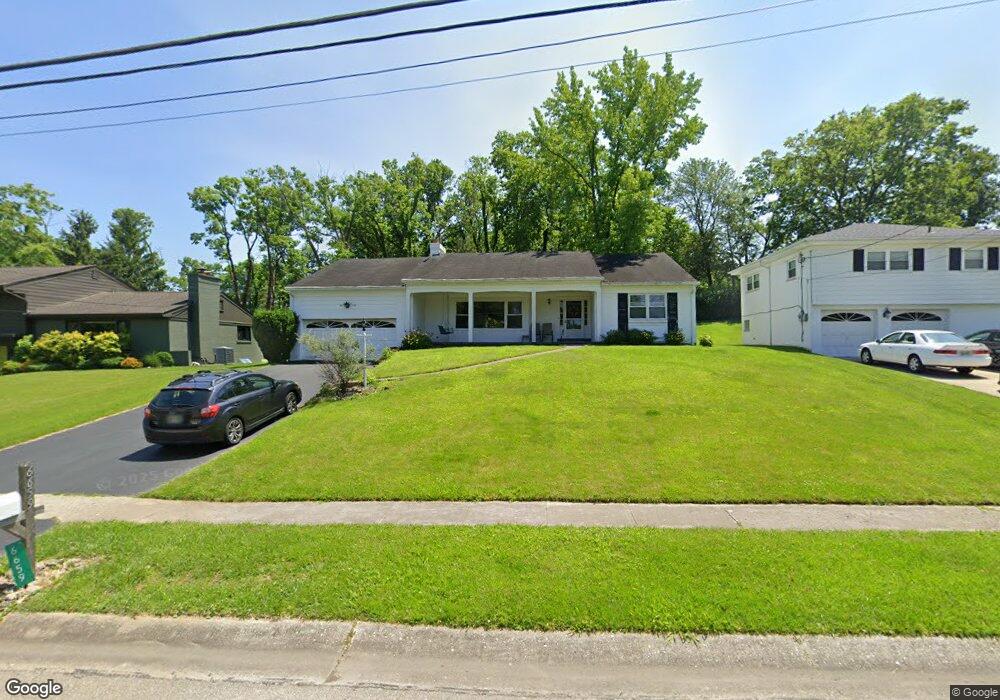
6659 Apache Cir Cincinnati, OH 45243
Estimated Value: $446,000 - $572,000
3
Beds
3
Baths
1,842
Sq Ft
$287/Sq Ft
Est. Value
About This Home
This home is located at 6659 Apache Cir, Cincinnati, OH 45243 and is currently estimated at $528,469, approximately $286 per square foot. 6659 Apache Cir is a home located in Hamilton County with nearby schools including Madeira Elementary School, Madeira Middle School, and Madeira High School.
Ownership History
Date
Name
Owned For
Owner Type
Purchase Details
Closed on
Jun 27, 2005
Sold by
Dinneny Cr and Dinneny Melinda J
Bought by
Herr Jason R
Current Estimated Value
Home Financials for this Owner
Home Financials are based on the most recent Mortgage that was taken out on this home.
Original Mortgage
$187,000
Outstanding Balance
$95,682
Interest Rate
5.75%
Mortgage Type
Unknown
Estimated Equity
$432,787
Purchase Details
Closed on
Jun 24, 2002
Sold by
Gellenbeck Edward D
Bought by
Dinneny Cr and Dinneny Melinda J
Purchase Details
Closed on
Nov 25, 1998
Sold by
Sauers Lynne Gellenbeck
Bought by
Gellenbeck Edward D
Purchase Details
Closed on
Apr 14, 1997
Sold by
Gellenbeck Edward D
Bought by
Gellenbeck Edward D and Sauers Lynne Gellenbeck
Create a Home Valuation Report for This Property
The Home Valuation Report is an in-depth analysis detailing your home's value as well as a comparison with similar homes in the area
Home Values in the Area
Average Home Value in this Area
Purchase History
| Date | Buyer | Sale Price | Title Company |
|---|---|---|---|
| Herr Jason R | $220,000 | Advanced Land Title Agency | |
| Dinneny Cr | $204,900 | -- | |
| Gellenbeck Edward D | -- | -- | |
| Gellenbeck Edward D | -- | -- |
Source: Public Records
Mortgage History
| Date | Status | Borrower | Loan Amount |
|---|---|---|---|
| Open | Herr Jason R | $187,000 |
Source: Public Records
Tax History
| Year | Tax Paid | Tax Assessment Tax Assessment Total Assessment is a certain percentage of the fair market value that is determined by local assessors to be the total taxable value of land and additions on the property. | Land | Improvement |
|---|---|---|---|---|
| 2025 | $7,649 | $130,074 | $48,265 | $81,809 |
| 2023 | $7,549 | $130,074 | $48,265 | $81,809 |
| 2022 | $6,952 | $97,920 | $36,771 | $61,149 |
| 2021 | $6,804 | $97,920 | $36,771 | $61,149 |
| 2020 | $6,295 | $97,920 | $36,771 | $61,149 |
| 2019 | $6,623 | $95,067 | $35,700 | $59,367 |
| 2018 | $6,676 | $95,067 | $35,700 | $59,367 |
| 2017 | $6,330 | $95,067 | $35,700 | $59,367 |
| 2016 | $4,731 | $66,977 | $15,789 | $51,188 |
| 2015 | $4,377 | $66,977 | $15,789 | $51,188 |
| 2014 | $4,402 | $66,977 | $15,789 | $51,188 |
| 2013 | $4,709 | $69,049 | $16,279 | $52,770 |
Source: Public Records
Map
Nearby Homes
- 6495 Dawson Rd
- 6752 Rose Crest Ave
- 7406 Dawson Rd
- 7469 Camargo Rd
- 7437 Madeira Pines Dr
- 6095 Kenwood Rd
- 6242 Fulsher Ln
- 5995 Crabtree Ln
- 7151 Euclid Ave
- 7474 Dawson Rd
- 6041 Johnson St
- 7159 Hosbrook Rd
- 7133 Fowler Ave
- 7317 Euclid Ave
- 7335 Demar Rd
- 7220 Mar Del Dr
- 6300 Miami Rd
- 7321 Hosbrook Rd
- 5801 Kenwood Rd
- 7752 Montgomery Rd
- 6653 Apache Cir
- 6663 Apache Cir
- 6649 Apache Cir
- 6669 Apache Cir
- 6660 Apache Cir
- 6654 Apache Cir
- 6664 Apache Cir
- 6643 Apache Cir
- 6650 Apache Cir
- 6670 Apache Cir
- 6674 Shawnee Run Rd
- 6700 Shawnee Run Rd
- 6650 Shawnee Run Rd
- 6644 Apache Cir
- 6724 Shawnee Run Rd
- 6639 Apache Cir
- 6680 Apache Cir
- 6679 Apache Cir
- 6541 Apache Cir
- 6537 Apache Cir
Your Personal Tour Guide
Ask me questions while you tour the home.