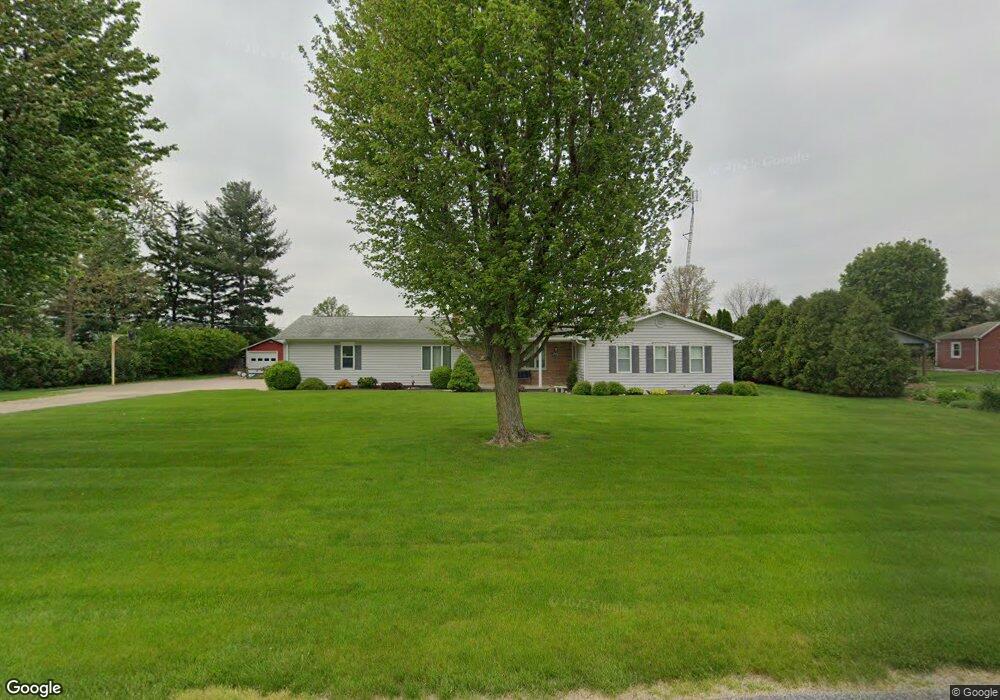
6659 Peltier Rd Delphos, OH 45833
Estimated Value: $240,000 - $275,000
About This Home
This home is located at 6659 Peltier Rd, Delphos, OH 45833 and is currently estimated at $252,302, approximately $125 per square foot. 6659 Peltier Rd is a home located in Allen County with nearby schools including Delphos St. John's Elementary School and Delphos St. John's High School.
Ownership History
We collect this data history from publicly available records. To have your information removed, we recommend requesting removal directly through your county’s website.
Purchase Details
Purchase Details
Purchase Details
Home Values in the Area
Average Home Value in this Area
Purchase History
We collect this data history from publicly available records. To have your information removed, we recommend requesting removal directly through your county’s website.
| Date | Buyer | Sale Price | Title Company |
|---|---|---|---|
| -- | None Listed On Document | ||
| -- | None Available | ||
| -- | -- |
Tax History
We collect this data history from publicly available records. To have your information removed, we recommend requesting removal directly through your county’s website.
| Year | Tax Paid | Tax Assessment Tax Assessment Total Assessment is a certain percentage of the fair market value that is determined by local assessors to be the total taxable value of land and additions on the property. | Land | Improvement |
|---|---|---|---|---|
| 2025 | $1,712 | $65,310 | $10,850 | $54,460 |
| 2024 | $1,718 | $65,310 | $10,850 | $54,460 |
| 2023 | $1,363 | $50,610 | $8,400 | $42,210 |
| 2022 | $1,393 | $50,610 | $8,400 | $42,210 |
| 2021 | $1,395 | $50,610 | $8,400 | $42,210 |
| 2020 | $1,097 | $42,670 | $7,670 | $35,000 |
| 2019 | $1,097 | $42,670 | $7,670 | $35,000 |
| 2018 | $1,099 | $42,670 | $7,670 | $35,000 |
| 2017 | $1,014 | $39,490 | $7,670 | $31,820 |
| 2016 | $995 | $39,490 | $7,670 | $31,820 |
| 2015 | $953 | $39,490 | $7,670 | $31,820 |
| 2014 | $953 | $37,880 | $7,040 | $30,840 |
| 2013 | $953 | $37,880 | $7,040 | $30,840 |
Map
- 10234 Elida Rd
- 7110 Elida Rd
- 1000 Colettas Way
- 904 E 2nd St
- 742 E 4th St
- 333 S Pierce St
- 532 E 3rd St
- 1114 Rozelle Ave
- 528 S Main St
- 484 S Main St
- 334 S Main St
- 1103 Jennings Rd
- 509 E 8th St
- 427 S Main St
- 6225 Redd Rd
- 221 S Main St
- 424 S Canal St
- 1400 S Clay St Unit Lot 12
- 201 E 5th St
- 610 N Washington St
- 6633 Peltier Rd
- 10305 Ridge Rd
- 10355 Ridge Rd
- 6601 Peltier Rd
- 10306 Ridge Rd
- 10375 Ridge Rd
- 6565 Peltier Rd
- 6543 Peltier Rd
- 10425 Ridge Rd
- 10463 Ridge Rd
- 10470 Elida Rd
- 10260 Elida Rd
- 10150 Ridge Rd
- 10520 Elida Rd
- 10479 Ridge Rd
- 10480 Ridge Rd
- 6455 Peltier Rd
- 6463 Peltier Rd
- 10536 Elida Rd
- 10525 Ridge Rd
Ask me questions while you tour the home.