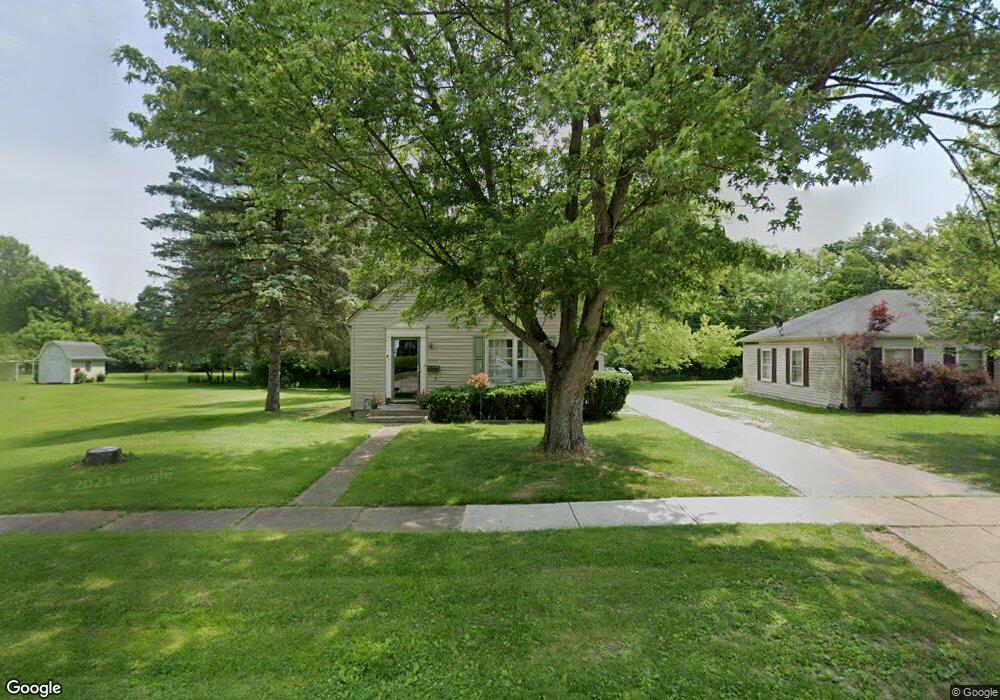
666 Bernice St Wilmington, OH 45177
Estimated Value: $189,219 - $237,000
3
Beds
1
Bath
720
Sq Ft
$288/Sq Ft
Est. Value
About This Home
This home is located at 666 Bernice St, Wilmington, OH 45177 and is currently estimated at $207,305, approximately $287 per square foot. 666 Bernice St is a home located in Clinton County with nearby schools including Wilmington High School, Arcadia Learning Commons, and Wilmington Christian Academy.
Ownership History
Date
Name
Owned For
Owner Type
Purchase Details
Closed on
Jun 17, 2025
Sold by
Elm Companies Llc and Showen Homes Llc
Bought by
Goodrich Samantha and Goodrich Anthony
Current Estimated Value
Home Financials for this Owner
Home Financials are based on the most recent Mortgage that was taken out on this home.
Original Mortgage
$169,000
Outstanding Balance
$168,566
Interest Rate
6.81%
Mortgage Type
New Conventional
Estimated Equity
$38,739
Purchase Details
Closed on
Oct 9, 2020
Sold by
Bryant Melanie J
Bought by
Elm Companies Llc
Home Financials for this Owner
Home Financials are based on the most recent Mortgage that was taken out on this home.
Original Mortgage
$46,000
Interest Rate
2.9%
Mortgage Type
New Conventional
Purchase Details
Closed on
Jun 12, 2019
Sold by
Drake Thomas J and Drake Deborah K
Bought by
Bryant Melanie J
Purchase Details
Closed on
Jan 1, 1990
Bought by
Drake Thomas J and Drake Deborah K
Create a Home Valuation Report for This Property
The Home Valuation Report is an in-depth analysis detailing your home's value as well as a comparison with similar homes in the area
Home Values in the Area
Average Home Value in this Area
Purchase History
| Date | Buyer | Sale Price | Title Company |
|---|---|---|---|
| Goodrich Samantha | $166 | None Listed On Document | |
| Elm Companies Llc | $86,000 | None Available | |
| Bryant Melanie J | $45,000 | None Available | |
| Drake Thomas J | -- | -- |
Source: Public Records
Mortgage History
| Date | Status | Borrower | Loan Amount |
|---|---|---|---|
| Open | Goodrich Samantha | $169,000 | |
| Previous Owner | Elm Companies Llc | $46,000 |
Source: Public Records
Tax History Compared to Growth
Tax History
| Year | Tax Paid | Tax Assessment Tax Assessment Total Assessment is a certain percentage of the fair market value that is determined by local assessors to be the total taxable value of land and additions on the property. | Land | Improvement |
|---|---|---|---|---|
| 2024 | $1,171 | $33,990 | $7,810 | $26,180 |
| 2023 | $1,171 | $33,990 | $7,810 | $26,180 |
| 2022 | $1,140 | $31,140 | $7,140 | $24,000 |
| 2021 | $1,154 | $24,960 | $7,140 | $17,820 |
| 2020 | $870 | $24,960 | $7,140 | $17,820 |
| 2019 | $813 | $21,310 | $7,140 | $14,170 |
| 2018 | $5,482 | $21,310 | $7,140 | $14,170 |
| 2017 | $1,952 | $21,310 | $7,140 | $14,170 |
| 2016 | $1,027 | $22,190 | $7,140 | $15,050 |
| 2015 | $4,701 | $22,190 | $7,140 | $15,050 |
| 2013 | $4,949 | $23,450 | $7,140 | $16,310 |
Source: Public Records
Map
Nearby Homes
- 116 Woodland Dr
- 950 Southridge Ave
- 71 W Short St
- 163 W Truesdell St
- 149 W Truesdell St
- 184 S Wood St Unit 186
- 186 S Wood St
- 338 S Walnut St
- 289 S Walnut St
- 62 Gallup St
- 12 Peterson Place
- 272 S Walnut St
- 49 S Wood St
- 454 Belmont Ave
- 51 N Wood St
- 0 S US Rt 68 Unit 1527315
- 0 St Rt 134 Unit 1607133
- 136 N Spring St
- 146 N Spring St
- 909 W Main St