Estimated Value: $693,000 - $780,000
3
Beds
2
Baths
1,646
Sq Ft
$437/Sq Ft
Est. Value
About This Home
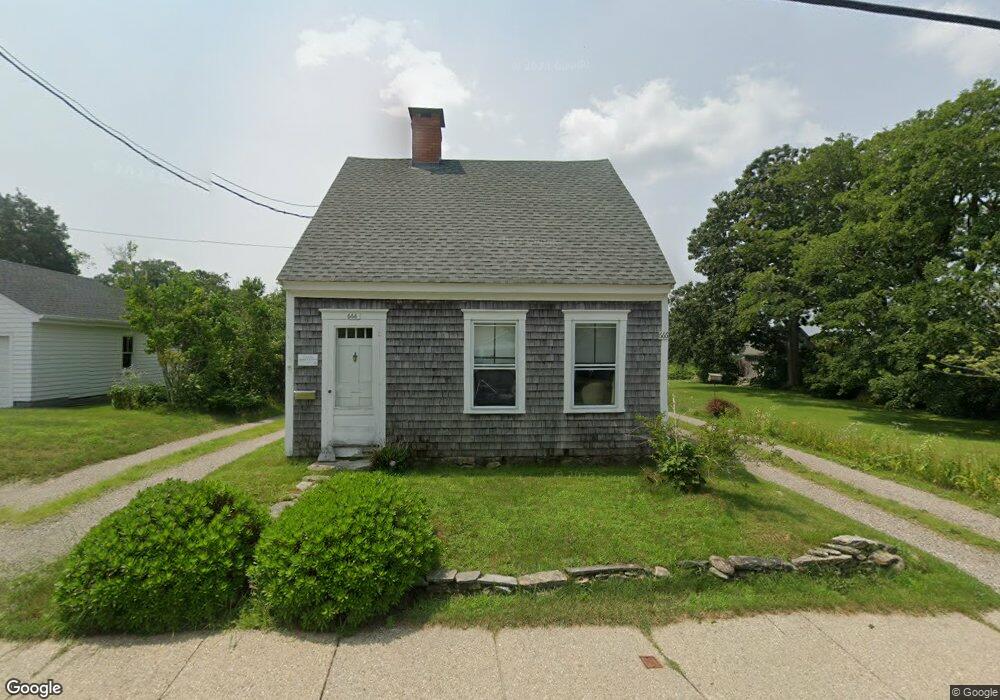
This home is located at 666 Elm St, South Dartmouth, MA 02748 and is currently estimated at $719,071, approximately $436 per square foot. 666 Elm St is a home located in Bristol County with nearby schools including Dartmouth High School and St. Teresa of Calcutta School.
Ownership History
Date
Name
Owned For
Owner Type
Purchase Details
Closed on
Mar 3, 2016
Sold by
Chace Aurore B
Bought by
Chace Aurore B and Hayes Deborah A
Current Estimated Value
Purchase Details
Closed on
Jan 25, 2007
Sold by
Chace Aurore B
Bought by
Sheldon Ann Chace and Chace Aurore B
Purchase Details
Closed on
Nov 21, 2006
Sold by
Chace Rt
Bought by
Chace Aurore B
Purchase Details
Closed on
Dec 19, 1995
Sold by
Hyde John P
Bought by
Pieper Mary C and Smith Lelia D
Home Financials for this Owner
Home Financials are based on the most recent Mortgage that was taken out on this home.
Original Mortgage
$129,000
Interest Rate
7.43%
Mortgage Type
Purchase Money Mortgage
Create a Home Valuation Report for This Property
The Home Valuation Report is an in-depth analysis detailing your home's value as well as a comparison with similar homes in the area
Home Values in the Area
Average Home Value in this Area
Purchase History
| Date | Buyer | Sale Price | Title Company |
|---|---|---|---|
| Chace Aurore B | -- | -- | |
| Sheldon Ann Chace | -- | -- | |
| Chace Aurore B | -- | -- | |
| Pieper Mary C | $130,000 | -- |
Source: Public Records
Mortgage History
| Date | Status | Borrower | Loan Amount |
|---|---|---|---|
| Previous Owner | Pieper Mary C | $65,000 | |
| Previous Owner | Pieper Mary C | $129,000 |
Source: Public Records
Tax History Compared to Growth
Tax History
| Year | Tax Paid | Tax Assessment Tax Assessment Total Assessment is a certain percentage of the fair market value that is determined by local assessors to be the total taxable value of land and additions on the property. | Land | Improvement |
|---|---|---|---|---|
| 2025 | $5,606 | $651,100 | $380,700 | $270,400 |
| 2024 | $5,447 | $626,800 | $364,100 | $262,700 |
| 2023 | $5,262 | $573,800 | $331,000 | $242,800 |
| 2022 | $5,165 | $521,700 | $311,100 | $210,600 |
| 2021 | $1,443 | $452,900 | $286,000 | $166,900 |
| 2020 | $1,510 | $447,200 | $292,500 | $154,700 |
| 2019 | $4,605 | $442,800 | $289,300 | $153,500 |
| 2018 | $1,691 | $415,200 | $281,200 | $134,000 |
| 2017 | $4,109 | $410,100 | $280,600 | $129,500 |
| 2016 | $3,974 | $391,100 | $262,300 | $128,800 |
| 2015 | $4,013 | $395,800 | $265,000 | $130,800 |
| 2014 | $3,607 | $353,300 | $224,800 | $128,500 |
Source: Public Records
Map
Nearby Homes
- 21 Avis St
- 212 Rockland St
- 76 Shipyard Ln
- 48 Wilson St
- 3 Mishawum Dr
- 5 Samosett Dr
- 179 Rockland St
- 6 Jacob Dr
- 360 Russells Mills Rd
- 75 Country Way Unit 75
- 34 Country Way
- 33 Rosewood Terrace
- 00 Prospect St
- 29 Elizabeth Ct
- 15 Puritan St
- 98 Mccabe St
- 1 Walter St
- 6 Walters Way
- 59 Hidden Bay Dr
- 40 School St