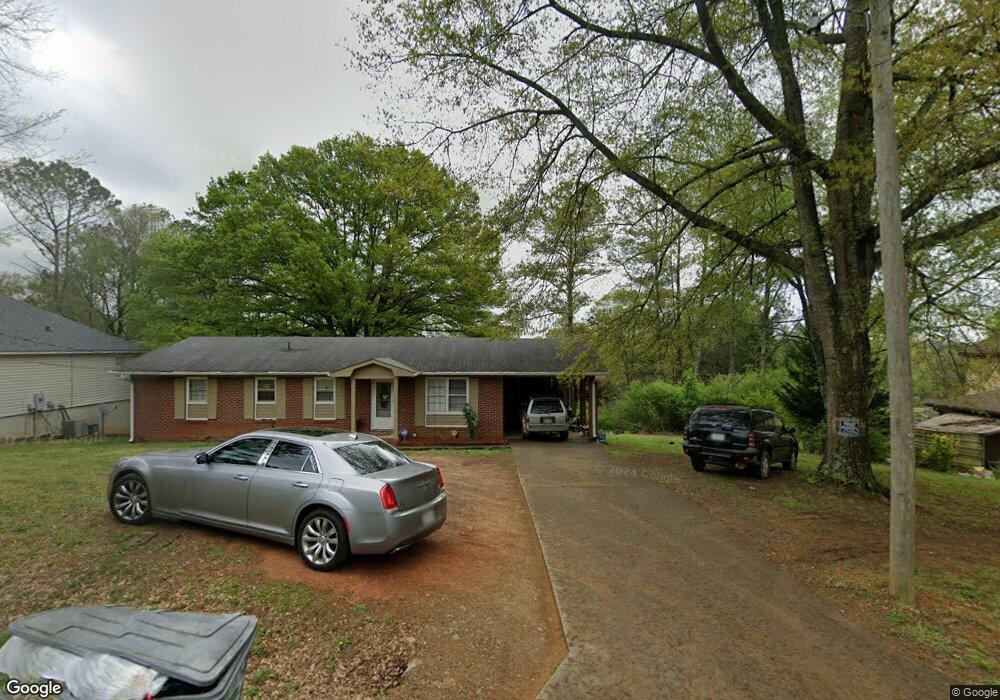
666 Hillside Dr Cedartown, GA 30125
Estimated Value: $145,000 - $220,014
3
Beds
2
Baths
1,248
Sq Ft
$153/Sq Ft
Est. Value
About This Home
This home is located at 666 Hillside Dr, Cedartown, GA 30125 and is currently estimated at $190,504, approximately $152 per square foot. 666 Hillside Dr is a home located in Polk County with nearby schools including Cedar Christian School and Vineyard Harvester Christian Academy.
Ownership History
Date
Name
Owned For
Owner Type
Purchase Details
Closed on
Jul 14, 2022
Sold by
Ayala Cruz Tikas
Bought by
Wynn Ambar
Current Estimated Value
Home Financials for this Owner
Home Financials are based on the most recent Mortgage that was taken out on this home.
Original Mortgage
$184,594
Outstanding Balance
$174,482
Interest Rate
4.87%
Mortgage Type
FHA
Estimated Equity
$16,022
Purchase Details
Closed on
Oct 31, 2016
Sold by
Jo Debra
Bought by
Ayala Cruz
Purchase Details
Closed on
May 9, 1990
Sold by
Busby Dennis Michael
Bought by
Busby Debra Jo
Purchase Details
Closed on
Apr 10, 1975
Sold by
Roberson Dave
Bought by
Busby Dennis M
Purchase Details
Closed on
Jun 3, 1974
Sold by
Winn Dan and Winn
Bought by
Roberson Dave
Purchase Details
Closed on
Nov 30, 1972
Sold by
World Wide Sales Inc
Bought by
Winn Dan and Winn
Purchase Details
Closed on
Sep 30, 1967
Bought by
World Wide Sales Inc
Create a Home Valuation Report for This Property
The Home Valuation Report is an in-depth analysis detailing your home's value as well as a comparison with similar homes in the area
Purchase History
| Date | Buyer | Sale Price | Title Company |
|---|---|---|---|
| Wynn Ambar | $195,000 | -- | |
| Ayala Cruz | $30,000 | -- | |
| Busby Debra Jo | -- | -- | |
| Busby Dennis M | -- | -- | |
| Roberson Dave | -- | -- | |
| Winn Dan | -- | -- | |
| World Wide Sales Inc | -- | -- |
Source: Public Records
Mortgage History
| Date | Status | Borrower | Loan Amount |
|---|---|---|---|
| Open | Wynn Ambar | $184,594 |
Source: Public Records
Tax History
| Year | Tax Paid | Tax Assessment Tax Assessment Total Assessment is a certain percentage of the fair market value that is determined by local assessors to be the total taxable value of land and additions on the property. | Land | Improvement |
|---|---|---|---|---|
| 2025 | $957 | $42,546 | $5,040 | $37,506 |
| 2024 | $889 | $42,546 | $5,040 | $37,506 |
| 2023 | $683 | $28,776 | $5,040 | $23,736 |
| 2022 | $562 | $23,691 | $3,360 | $20,331 |
| 2021 | $570 | $23,691 | $3,360 | $20,331 |
| 2020 | $571 | $23,691 | $3,360 | $20,331 |
| 2019 | $542 | $20,183 | $3,659 | $16,524 |
| 2018 | $517 | $18,754 | $2,781 | $15,973 |
| 2017 | $510 | $18,754 | $2,781 | $15,973 |
| 2016 | $456 | $18,754 | $2,781 | $15,973 |
| 2015 | $458 | $18,774 | $2,781 | $15,994 |
| 2014 | $447 | $18,246 | $2,253 | $15,994 |
Source: Public Records
Map
Nearby Homes
- 645 Valley Rd
- 618 Valley Rd
- 77 Ben Dr W
- 65 Oakwood Dr
- 0 Woodall Rd Unit 7730884
- 0 Woodall Rd Unit 10705831
- 1101 East Ave
- 0 Joy Dr Unit 7702866
- 0 Joy Dr Unit 10669012
- 0 Joy Dr Unit 56
- 00 Joy Dr
- 0 Blanche Rd Unit 10668579
- 0 Blanche Rd Unit 7701366
- 305 Greenview Ct
- 10 Woodglen Dr
- 202 Ridgewood Rd
- 254 E Girard Ave
- 206 Turner St
- 220 John Phillips Rd
- 240 John Phillips Rd
- 664 Hillside Dr
- 668 Hillside Dr
- 654 Hillside Dr
- 654 Hillside Dr
- 653 Hillside Dr
- 655 Woodland Rd
- 657 Woodland Rd
- 208 Eastview Dr
- 204 E View Dr
- 208 E View Dr
- 662 Collard Valley Rd
- 653 Woodland Rd
- 657 Valley Rd
- 649 Hillside Dr
- 0 Eastview Rd Unit 7242259
- 0 Eastview Rd Unit 7141189
- 0 Eastview Rd Unit 7009716
- 0 Eastview Rd Unit 9011143
- 0 Eastview Rd Unit 9011140
- 0 Eastview Rd Unit 9011133
Your Personal Tour Guide
Ask me questions while you tour the home.