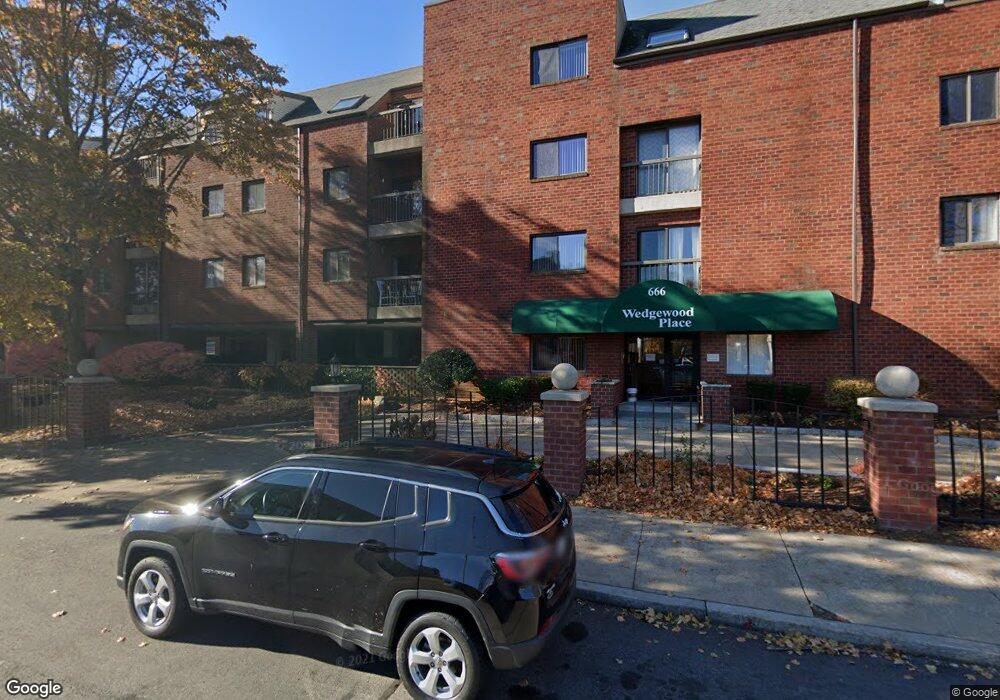
666 Main St Unit 411 Winchester, MA 01890
Estimated Value: $705,272 - $850,000
2
Beds
2
Baths
1,170
Sq Ft
$662/Sq Ft
Est. Value
About This Home
This home is located at 666 Main St Unit 411, Winchester, MA 01890 and is currently estimated at $774,568, approximately $662 per square foot. 666 Main St Unit 411 is a home located in Middlesex County with nearby schools including Lincoln Elementary School, McCall Middle School, and Winchester High School.
Ownership History
Date
Name
Owned For
Owner Type
Purchase Details
Closed on
Aug 4, 2015
Sold by
6 Holland Street Rt
Bought by
Wedgewood Place Rt
Current Estimated Value
Purchase Details
Closed on
Nov 24, 2008
Sold by
Penna Rt and Penna Murial C
Bought by
6 Holland Street Rt and Lashus-Takacs B I
Purchase Details
Closed on
Sep 2, 2004
Sold by
Penna Muriel C
Bought by
Penna Realty Nt and Penna Muriel C
Purchase Details
Closed on
Feb 26, 1998
Sold by
Shea Kathleen E
Bought by
Penna Muriel C
Home Financials for this Owner
Home Financials are based on the most recent Mortgage that was taken out on this home.
Original Mortgage
$100,000
Interest Rate
6.85%
Mortgage Type
Purchase Money Mortgage
Purchase Details
Closed on
Apr 29, 1994
Sold by
Lindquist Lill
Bought by
Shea Kathleen E
Home Financials for this Owner
Home Financials are based on the most recent Mortgage that was taken out on this home.
Original Mortgage
$90,000
Interest Rate
7.7%
Mortgage Type
Purchase Money Mortgage
Create a Home Valuation Report for This Property
The Home Valuation Report is an in-depth analysis detailing your home's value as well as a comparison with similar homes in the area
Purchase History
| Date | Buyer | Sale Price | Title Company |
|---|---|---|---|
| Wedgewood Place Rt | $445,000 | -- | |
| 6 Holland Street Rt | $400,000 | -- | |
| Penna Realty Nt | -- | -- | |
| Penna Muriel C | $210,000 | -- | |
| Shea Kathleen E | $130,000 | -- |
Source: Public Records
Mortgage History
| Date | Status | Borrower | Loan Amount |
|---|---|---|---|
| Previous Owner | Shea Kathleen E | $100,000 | |
| Previous Owner | Shea Kathleen E | $87,000 | |
| Previous Owner | Shea Kathleen E | $90,000 |
Source: Public Records
Tax History
| Year | Tax Paid | Tax Assessment Tax Assessment Total Assessment is a certain percentage of the fair market value that is determined by local assessors to be the total taxable value of land and additions on the property. | Land | Improvement |
|---|---|---|---|---|
| 2025 | $82 | $742,100 | $0 | $742,100 |
| 2024 | $7,615 | $672,100 | $0 | $672,100 |
| 2023 | $6,886 | $583,600 | $0 | $583,600 |
| 2022 | $6,946 | $555,200 | $0 | $555,200 |
| 2021 | $7,201 | $561,300 | $0 | $561,300 |
| 2020 | $6,955 | $561,300 | $0 | $561,300 |
| 2019 | $6,053 | $499,800 | $0 | $499,800 |
| 2018 | $5,650 | $463,500 | $0 | $463,500 |
| 2017 | $5,634 | $458,800 | $0 | $458,800 |
| 2016 | $5,202 | $445,400 | $0 | $445,400 |
| 2015 | $5,282 | $435,100 | $0 | $435,100 |
| 2014 | $5,516 | $435,700 | $0 | $435,700 |
Source: Public Records
Map
Nearby Homes
- 115 Washington St Unit 2A
- 200 Swanton St Unit 228
- 200 Swanton St Unit T28
- 13 Nelson St
- 62 Richardson St
- 22 Oak St
- 237 Swanton St
- 259 Washington St
- 6 Ivy Cir
- 263 Highland Ave
- 20 Arthur St
- 171 Swanton St Unit 73
- 320 Washington St
- 353-355 Washington St
- 45 Bacon St
- 8 Russell Rd Unit 10
- 149 Horn Pond Brook Rd
- 7 Conant Rd Unit 33
- 12 Yale St
- 76 Woodside Rd
- 666 Main St Unit 417
- 666 Main St Unit 415
- 666 Main St Unit 412
- 666 Main St Unit 410
- 666 Main St Unit 409
- 666 Main St Unit 408
- 666 Main St Unit 407
- 666 Main St Unit 406
- 666 Main St Unit 405
- 666 Main St Unit 404
- 666 Main St Unit 403
- 666 Main St Unit 402
- 666 Main St Unit 401
- 666 Main St Unit 317
- 666 Main St Unit 315
- 666 Main St Unit 311
- 666 Main St Unit 310
- 666 Main St Unit 309
- 666 Main St Unit 308
- 666 Main St Unit 307
Your Personal Tour Guide
Ask me questions while you tour the home.