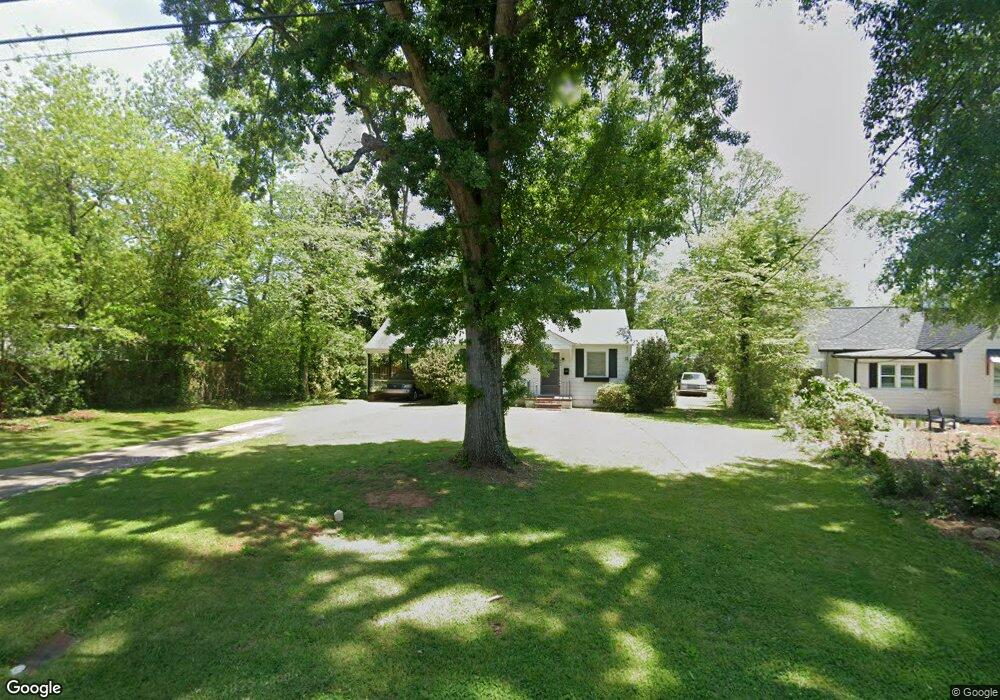
666 Maple Dr Griffin, GA 30224
Spalding County NeighborhoodEstimated Value: $129,402 - $195,000
2
Beds
1
Bath
778
Sq Ft
$211/Sq Ft
Est. Value
About This Home
This home is located at 666 Maple Dr, Griffin, GA 30224 and is currently estimated at $164,351, approximately $211 per square foot. 666 Maple Dr is a home located in Spalding County with nearby schools including Crescent Road Elementary School, Rehoboth Road Middle School, and Spalding High School.
Ownership History
Date
Name
Owned For
Owner Type
Purchase Details
Closed on
Jun 22, 2020
Sold by
Pack David
Bought by
Pack David and Pack Andree J
Current Estimated Value
Purchase Details
Closed on
Oct 15, 2018
Sold by
Scibetta Matthew A
Bought by
Pack David
Home Financials for this Owner
Home Financials are based on the most recent Mortgage that was taken out on this home.
Original Mortgage
$85,424
Interest Rate
4.62%
Mortgage Type
FHA
Purchase Details
Closed on
Dec 16, 2002
Sold by
Powers Judy W
Bought by
Scibetta Matthew A
Home Financials for this Owner
Home Financials are based on the most recent Mortgage that was taken out on this home.
Original Mortgage
$76,750
Interest Rate
6.08%
Mortgage Type
New Conventional
Purchase Details
Closed on
Mar 20, 1992
Sold by
Goldstein Alvin L
Bought by
Powers Judy W
Purchase Details
Closed on
Sep 7, 1979
Sold by
Clark Ruby
Bought by
Toland Lance Paige
Purchase Details
Closed on
Jul 25, 1952
Bought by
Clark Ruby
Create a Home Valuation Report for This Property
The Home Valuation Report is an in-depth analysis detailing your home's value as well as a comparison with similar homes in the area
Home Values in the Area
Average Home Value in this Area
Purchase History
| Date | Buyer | Sale Price | Title Company |
|---|---|---|---|
| Pack David | -- | -- | |
| Pack David | $87,000 | -- | |
| Scibetta Matthew A | $76,800 | -- | |
| Powers Judy W | $33,200 | -- | |
| Goldstein Alvin L | $33,200 | -- | |
| Toland Lance Paige | $24,500 | -- | |
| Clark Ruby | -- | -- |
Source: Public Records
Mortgage History
| Date | Status | Borrower | Loan Amount |
|---|---|---|---|
| Previous Owner | Pack David | $85,424 | |
| Previous Owner | Scibetta Matthew A | $76,750 |
Source: Public Records
Tax History Compared to Growth
Tax History
| Year | Tax Paid | Tax Assessment Tax Assessment Total Assessment is a certain percentage of the fair market value that is determined by local assessors to be the total taxable value of land and additions on the property. | Land | Improvement |
|---|---|---|---|---|
| 2024 | $1,029 | $44,585 | $14,000 | $30,585 |
| 2023 | $1,220 | $44,585 | $14,000 | $30,585 |
| 2022 | $1,182 | $39,735 | $13,200 | $26,535 |
| 2021 | $1,107 | $36,759 | $13,200 | $23,559 |
| 2020 | $1,469 | $36,759 | $13,200 | $23,559 |
| 2019 | $1,373 | $33,734 | $13,200 | $20,534 |
| 2018 | $767 | $20,519 | $13,200 | $7,319 |
| 2017 | $714 | $19,655 | $13,200 | $6,455 |
| 2016 | $694 | $18,895 | $13,200 | $5,695 |
| 2015 | $705 | $18,895 | $13,200 | $5,695 |
| 2014 | $726 | $18,895 | $13,200 | $5,695 |
Source: Public Records
Map
Nearby Homes
- 706 Maple Dr
- 304 Tilney Ave
- 310 Terrace St
- 40 Terrace St
- 650 S Hill St
- 550 S Hill St
- 115 Kennelsman Dr Unit LOT FC 1
- 517 S 6th St
- 123 Huntsman Dr
- 319 E College St
- 644 Brook Cir
- 505 Kincaid Ave
- 1541 Zebulon Rd & Unit 4 TRACTS 35 ACRES
- 1099 Pine Valley Rd
- 850 Crescent Ln
- 859 Crescent Ln
- 402 Meriwether St
- 106 Summit Dr
- 861 Crescent Ln
- 805 Hale Ave