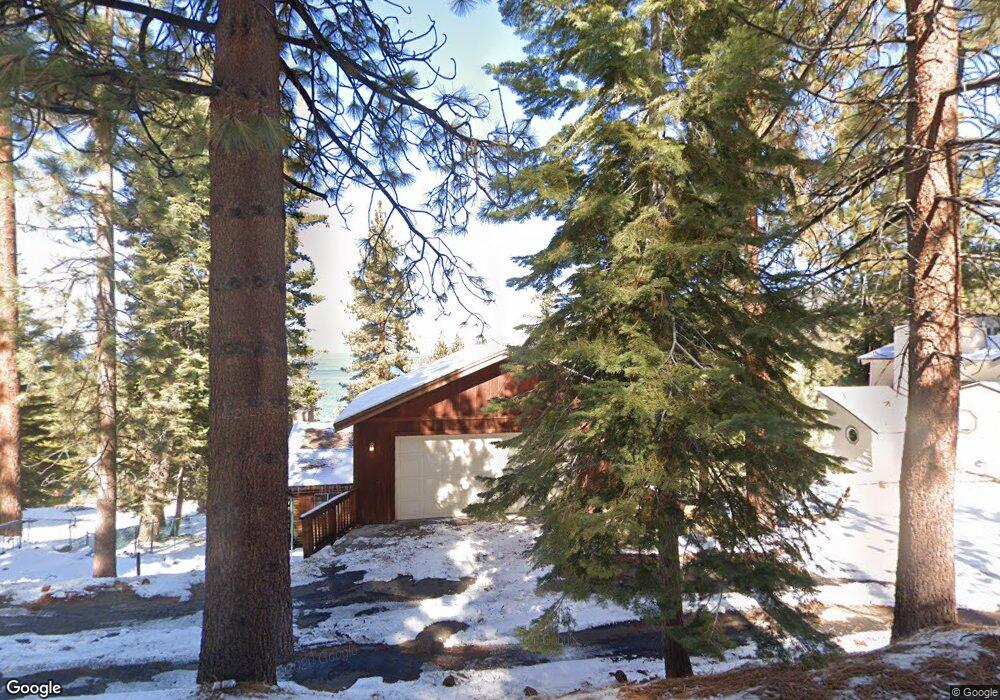
666 N Martin Dr Zephyr Cove, NV 89448
Estimated Value: $1,159,000 - $1,357,000
--
Bed
--
Bath
1,196
Sq Ft
$1,060/Sq Ft
Est. Value
About This Home
This home is located at 666 N Martin Dr, Zephyr Cove, NV 89448 and is currently estimated at $1,267,597, approximately $1,059 per square foot. 666 N Martin Dr is a home with nearby schools including Zephyr Cove Elementary School, George Whittell High School, and Douglas County High School.
Ownership History
Date
Name
Owned For
Owner Type
Purchase Details
Closed on
Jun 11, 2025
Sold by
Gael Gander Rodgers Revocable Trust and Rodgers Gael Gander
Bought by
Collom Family Revocable Trust and Collom
Current Estimated Value
Purchase Details
Closed on
Oct 30, 2020
Sold by
Collom Craig S
Bought by
Collom Craig S and Collom Colette R
Purchase Details
Closed on
Dec 7, 2017
Sold by
Reeg Christeen M
Bought by
Collom Craig S and Collom Brent D
Purchase Details
Closed on
Mar 18, 2015
Sold by
Collom Michael
Bought by
Collom Michael S and Michael S Collom Seperate Property Trust
Purchase Details
Closed on
Nov 29, 2007
Sold by
Rodgers Gael G and Collom Michael
Bought by
Rodgers Gael Gander and Gael Gander Rodgers Revocable Trust
Purchase Details
Closed on
Feb 23, 2006
Sold by
Dunne Patrick M
Bought by
Collom Michael
Purchase Details
Closed on
Jan 7, 2006
Sold by
Sammut Erin M and Dunne Erin M
Bought by
Collom Michael
Purchase Details
Closed on
Oct 24, 2005
Sold by
Collom Christeen Reeg and Collom Michael
Bought by
Collom Michael
Purchase Details
Closed on
Aug 1, 2005
Sold by
Sammut Erin M and Dunne Erin M
Bought by
Collom Michael
Create a Home Valuation Report for This Property
The Home Valuation Report is an in-depth analysis detailing your home's value as well as a comparison with similar homes in the area
Home Values in the Area
Average Home Value in this Area
Purchase History
| Date | Buyer | Sale Price | Title Company |
|---|---|---|---|
| Collom Family Revocable Trust | -- | None Listed On Document | |
| Collom Craig S | -- | None Available | |
| Collom Craig S | -- | None Available | |
| Collom Michael S | -- | First Centennial Reno | |
| Rodgers Gael Gander | -- | First Centennial Reno | |
| Rodgers Gael Gander | -- | Accommodation | |
| Collom Michael | $17,500 | None Available | |
| Collom Michael | $17,500 | None Available | |
| Collom Michael | -- | None Available | |
| Collom Michael | $17,500 | None Available |
Source: Public Records
Tax History Compared to Growth
Tax History
| Year | Tax Paid | Tax Assessment Tax Assessment Total Assessment is a certain percentage of the fair market value that is determined by local assessors to be the total taxable value of land and additions on the property. | Land | Improvement |
|---|---|---|---|---|
| 2025 | $3,583 | $143,668 | $110,250 | $33,418 |
| 2024 | $3,583 | $143,692 | $110,250 | $33,442 |
| 2023 | $3,338 | $140,750 | $110,250 | $30,500 |
| 2022 | $3,075 | $127,751 | $99,750 | $28,001 |
| 2021 | $2,845 | $113,598 | $87,500 | $26,098 |
| 2020 | $2,751 | $112,384 | $87,500 | $24,884 |
| 2019 | $2,650 | $97,339 | $73,500 | $23,839 |
| 2018 | $2,528 | $92,941 | $70,000 | $22,941 |
| 2017 | $2,429 | $92,786 | $70,000 | $22,786 |
| 2016 | $2,369 | $85,434 | $63,000 | $22,434 |
| 2015 | $2,360 | $85,434 | $63,000 | $22,434 |
| 2014 | $2,287 | $83,834 | $63,000 | $20,834 |
Source: Public Records
Map
Nearby Homes
- 664 Lookout Rd
- 225 S Martin Dr
- 227 S Martin Dr
- 621 Lakeview Dr
- 605 Jerry Dr
- 625 Lake Shore Blvd
- 670 Riven Rock Rd
- 600 U S 50 Unit 60
- 5 Ute Ct
- 259 Mc Faul Ct
- 450 Mcfaul Way Unit 17
- 464 Elks Ave
- 174 Myron Dr
- 1146 Highway 50
- 28 Beach Club Dr Unit 407
- 42 Beach Club Dr Unit 702
- 36 Beach Club Dr Unit 606
- 33 Beach Club Dr Unit 506
- 33 Beach Club Dr Unit 504
- 230 Clubhouse Cir
- 664 N Martin Dr
- 670 N Martin Dr
- 662 N Martin Dr
- 669 N Martin Dr
- 642 Zephyr Heights Dr
- 659 N Martin Dr
- 660 N Martin Dr
- 701 B U S 50
- 701 U S 50
- 695 Lakeview Blvd
- 638 Zephyr Heights Dr
- 1273 Hwy 50
- 693 Lakeview Blvd
- 643 Zephyr Heights Dr
- 634 Zephyr Heights Dr
- 643 Lookout Rd
- 682 Old Lincoln Hwy
- 687 Lakeview Blvd
- 689 Lakeview Blvd
- 656 N Martin Dr