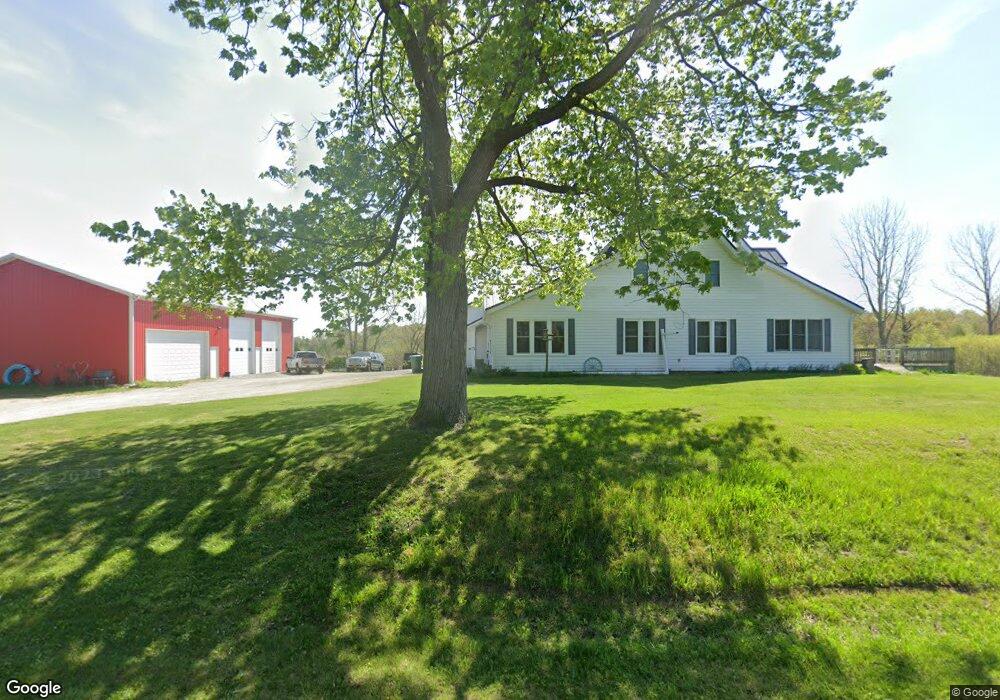
66679 Sherman Mill Rd Sturgis, MI 49091
Estimated Value: $246,000 - $391,000
--
Bed
--
Bath
1,620
Sq Ft
$207/Sq Ft
Est. Value
About This Home
This home is located at 66679 Sherman Mill Rd, Sturgis, MI 49091 and is currently estimated at $334,729, approximately $206 per square foot. 66679 Sherman Mill Rd is a home located in St. Joseph County with nearby schools including Sturgis High School.
Ownership History
Date
Name
Owned For
Owner Type
Purchase Details
Closed on
Apr 3, 2015
Sold by
Swam William Allan and Swan Lynn
Bought by
Scheetz Robert Carl and Dodson Ashley Marie
Current Estimated Value
Home Financials for this Owner
Home Financials are based on the most recent Mortgage that was taken out on this home.
Original Mortgage
$131,836
Outstanding Balance
$101,453
Interest Rate
3.73%
Mortgage Type
New Conventional
Estimated Equity
$233,276
Purchase Details
Closed on
Mar 14, 2008
Sold by
Walters Brent A
Bought by
Bolla Zachery G
Home Financials for this Owner
Home Financials are based on the most recent Mortgage that was taken out on this home.
Original Mortgage
$117,550
Interest Rate
5.75%
Mortgage Type
Purchase Money Mortgage
Purchase Details
Closed on
May 21, 2003
Sold by
Walters Pamela Jean
Bought by
Walters Brent A
Purchase Details
Closed on
Aug 26, 1991
Sold by
Wegner Donald L and Wegner Betty V
Bought by
Walters Brent A and Walters Pamela
Create a Home Valuation Report for This Property
The Home Valuation Report is an in-depth analysis detailing your home's value as well as a comparison with similar homes in the area
Home Values in the Area
Average Home Value in this Area
Purchase History
| Date | Buyer | Sale Price | Title Company |
|---|---|---|---|
| Scheetz Robert Carl | $129,200 | Abstract Title Agency | |
| Swan William Allan | $115,896 | Abstract Title Agency | |
| Bolla Zachery G | $114,000 | Patrick Abstract & Title Off | |
| Walters Brent A | -- | -- | |
| Walters Brent A | $49,000 | -- |
Source: Public Records
Mortgage History
| Date | Status | Borrower | Loan Amount |
|---|---|---|---|
| Open | Swan William Allan | $131,836 | |
| Previous Owner | Bolla Zachery G | $117,550 |
Source: Public Records
Tax History Compared to Growth
Tax History
| Year | Tax Paid | Tax Assessment Tax Assessment Total Assessment is a certain percentage of the fair market value that is determined by local assessors to be the total taxable value of land and additions on the property. | Land | Improvement |
|---|---|---|---|---|
| 2025 | $2,833 | $142,900 | $53,800 | $89,100 |
| 2024 | $968 | $131,300 | $46,900 | $84,400 |
| 2023 | $922 | $113,400 | $29,100 | $84,300 |
| 2022 | $0 | $94,300 | $21,000 | $73,300 |
| 2021 | $1,339 | $70,400 | $19,600 | $50,800 |
| 2020 | $685 | $69,700 | $18,800 | $50,900 |
| 2019 | $672 | $63,700 | $18,800 | $44,900 |
| 2018 | $1,737 | $62,200 | $18,800 | $43,400 |
| 2017 | $1,762 | $61,900 | $61,900 | $0 |
| 2016 | -- | $60,900 | $60,900 | $0 |
| 2015 | -- | $53,300 | $0 | $0 |
| 2014 | -- | $53,000 | $53,000 | $0 |
| 2012 | -- | $49,100 | $49,100 | $0 |
Source: Public Records
Map
Nearby Homes
- 23772 Wilson Rd
- 67696 Thunderbird Dr
- VL1 Ottokee Dr
- VL2 Ottokee Dr
- 0 Vl Seneca Ct
- 66109 Hideaway Ln
- 708 N Centerville Rd
- 65890 Burg Rd
- 27304 Oak Dr
- 200 Broadus St
- 22025 Airline Rd
- V/L Banker St
- 69375 Vicky Dr
- 206 1st St
- 26865 Us Highway 12
- 66223 Grey Lake Rd
- 600 Saint Joseph St
- 202 N Centerville Rd
- 805 N Nottawa St
- 609 Sturgis St
- 66934 Sherman Mill Rd
- 66778 Sherman Mill Rd
- 66806 Sherman Mill Rd
- 66872 Sherman Mill Rd
- 66892 Sherman Mill Rd
- 66892 Sherman Mill Rd
- 66517 Sherman Mill Rd
- 67032 Sherman Mill Rd
- 66952 Sherman Mill Rd
- 67064 Sherman Mill Rd
- 67044 Sherman Mill Rd
- 66805 Sherman Mill Rd
- 0 Sherman Mill Rd
- 0 Sherman Mill Rd
- 67001 Sherman Mill Rd
- 66468 Sherman Mill Rd
- 66421 Sherman Mill Rd
- 66421 Sherman Mill Rd
- 67074 Stubey Rd
- 67024 Stubey Rd