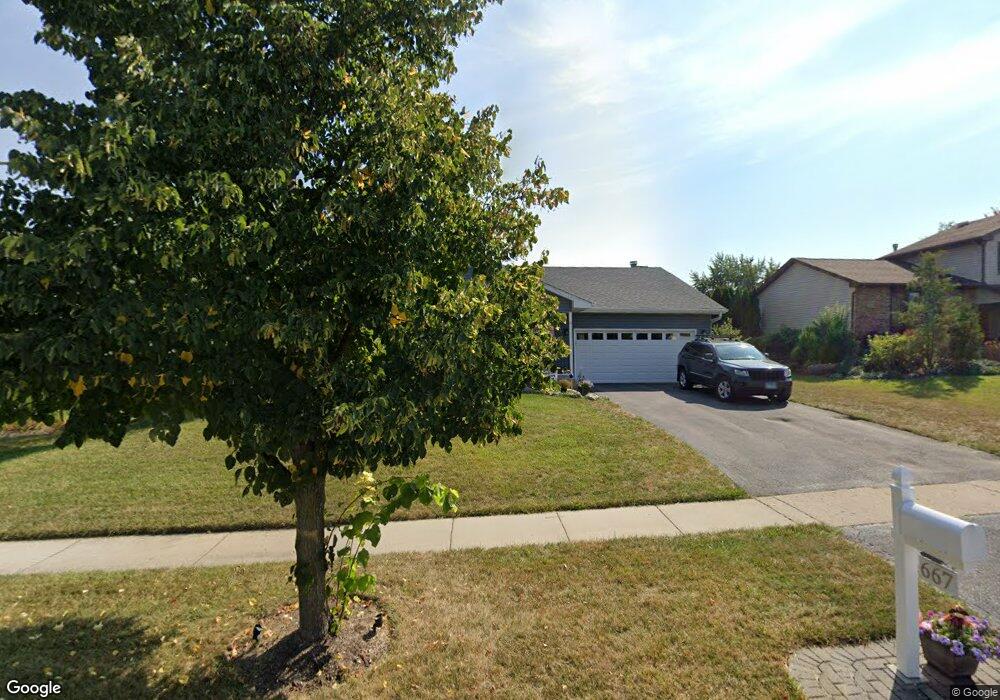
667 Colony Ave Lindenhurst, IL 60046
Estimated Value: $366,000 - $400,000
4
Beds
2
Baths
1,704
Sq Ft
$222/Sq Ft
Est. Value
About This Home
This home is located at 667 Colony Ave, Lindenhurst, IL 60046 and is currently estimated at $378,570, approximately $222 per square foot. 667 Colony Ave is a home located in Lake County with nearby schools including Millburn Elementary School, Millburn Middle School, and Lakes Community High School.
Ownership History
Date
Name
Owned For
Owner Type
Purchase Details
Closed on
Oct 27, 2017
Sold by
Palansky Carl S and Palansky Kimberly K
Bought by
Brean Aaron F
Current Estimated Value
Home Financials for this Owner
Home Financials are based on the most recent Mortgage that was taken out on this home.
Original Mortgage
$164,000
Outstanding Balance
$134,887
Interest Rate
3.88%
Mortgage Type
New Conventional
Estimated Equity
$243,683
Purchase Details
Closed on
Jun 28, 2002
Sold by
Preber Dolores M and The Dolores M Preber Self Decl
Bought by
Palansky Carl S and Palansky Kimberly K
Home Financials for this Owner
Home Financials are based on the most recent Mortgage that was taken out on this home.
Original Mortgage
$130,500
Interest Rate
6.7%
Purchase Details
Closed on
Jan 13, 1998
Sold by
Preber Dolores M
Bought by
Declarat Preber Dolores M and Declarat Dolores M Preber Self
Purchase Details
Closed on
Jun 18, 1997
Sold by
Liapis Peter John and Liapis Sharon Lynn
Bought by
Preber John J and Preber Dolores M
Purchase Details
Closed on
Aug 28, 1995
Sold by
Liapis Peter and Liapis Peter John
Bought by
Liapis Peter John and Liapis Sharon Lynn
Create a Home Valuation Report for This Property
The Home Valuation Report is an in-depth analysis detailing your home's value as well as a comparison with similar homes in the area
Home Values in the Area
Average Home Value in this Area
Purchase History
We collect this data history from publicly available records. To have your information removed, we recommend requesting removal directly through your county’s website.
| Date | Buyer | Sale Price | Title Company |
|---|---|---|---|
| Brean Aaron F | $205,000 | Chicago Title | |
| Palansky Carl S | $205,500 | -- | |
| Declarat Preber Dolores M | -- | -- | |
| Preber John J | $173,000 | -- | |
| Liapis Peter John | -- | -- |
Source: Public Records
Mortgage History
We collect this data history from publicly available records. To have your information removed, we recommend requesting removal directly through your county’s website.
| Date | Status | Borrower | Loan Amount |
|---|---|---|---|
| Open | Brean Aaron F | $164,000 | |
| Previous Owner | Palansky Carl S | $130,500 |
Source: Public Records
Tax History
| Year | Tax Paid | Tax Assessment Tax Assessment Total Assessment is a certain percentage of the fair market value that is determined by local assessors to be the total taxable value of land and additions on the property. | Land | Improvement |
|---|---|---|---|---|
| 2025 | $10,870 | $118,669 | $14,812 | $103,857 |
| 2024 | $10,093 | $110,626 | $13,808 | $96,818 |
| 2023 | $10,519 | $97,743 | $12,200 | $85,543 |
| 2022 | $10,519 | $83,900 | $9,285 | $74,615 |
| 2021 | $10,127 | $77,938 | $8,625 | $69,313 |
| 2020 | $10,364 | $79,721 | $8,822 | $70,899 |
| 2019 | $10,391 | $76,618 | $8,479 | $68,139 |
| 2018 | $8,819 | $70,138 | $14,499 | $55,639 |
| 2017 | $8,555 | $68,267 | $14,112 | $54,155 |
| 2016 | $8,502 | $65,503 | $13,541 | $51,962 |
| 2015 | $8,097 | $61,178 | $12,647 | $48,531 |
| 2014 | $9,024 | $58,963 | $12,706 | $46,257 |
| 2012 | $8,084 | $72,846 | $14,279 | $58,567 |
Source: Public Records
Map
Nearby Homes
- 2825 Haven Ln
- 2308 Carriage Ln
- 516 N Beck Rd
- 19135 W Millburn Rd
- 412 Surrey Ln
- 1896 E Vista Terrace
- 2375 Kelsey Ct
- 1816 Prairie Ridge Cir
- 2890 Trail Crest Ln
- 88 Hackney Ln
- 1920 Hazelwood Dr
- 1806 Hazelwood Dr
- 1695 Natures Way
- 20215 W Miller Rd
- 1809 Maplewood Ct
- 1575 Mcclellan Dr
- 3210 Neubauer Cir
- 210 Hazelwood Dr
- 2906 Glenarye Dr
- 1406 Neubauer Cir Unit 1904
- 675 Colony Ave
- 657 Colony Ave
- 685 Colony Ave
- 647 Colony Ave
- 665 Providence Ln
- 669 Providence Ln
- 661 Providence Ln
- 668 Colony Ave
- 656 Colony Ave
- 673 Providence Ln
- 676 Colony Ave
- 695 Colony Ave
- 637 Colony Ave
- 657 Providence Ln
- 648 Colony Ave
- 686 Colony Ave
- 638 Colony Ave
- 677 Providence Ln
- 701 Colony Ave
- 653 Providence Ln
Your Personal Tour Guide
Ask me questions while you tour the home.