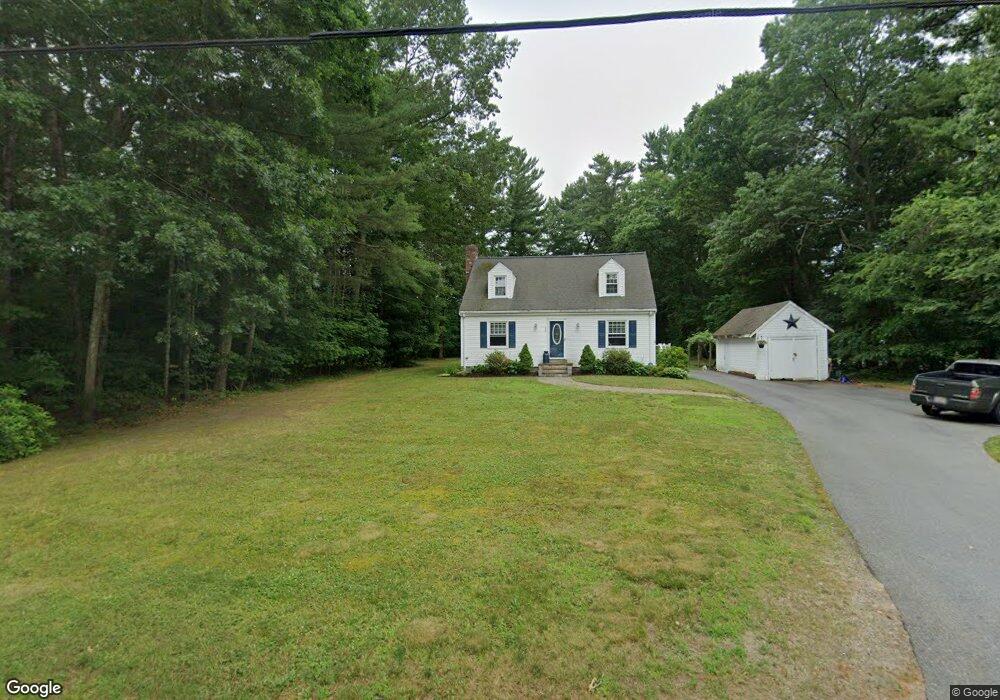
667 Union St East Bridgewater, MA 02333
Estimated Value: $495,061 - $604,000
3
Beds
2
Baths
1,456
Sq Ft
$367/Sq Ft
Est. Value
About This Home
This home is located at 667 Union St, East Bridgewater, MA 02333 and is currently estimated at $533,765, approximately $366 per square foot. 667 Union St is a home located in Plymouth County with nearby schools including Central Elementary School, Gordon W Mitchell Middle School, and East Bridgewater Jr./Sr. High School.
Ownership History
Date
Name
Owned For
Owner Type
Purchase Details
Closed on
Nov 7, 2016
Sold by
Desousa John F and Moura Susan M
Bought by
Moura Susan M
Current Estimated Value
Home Financials for this Owner
Home Financials are based on the most recent Mortgage that was taken out on this home.
Original Mortgage
$252,000
Outstanding Balance
$202,694
Interest Rate
3.48%
Mortgage Type
New Conventional
Estimated Equity
$331,071
Create a Home Valuation Report for This Property
The Home Valuation Report is an in-depth analysis detailing your home's value as well as a comparison with similar homes in the area
Home Values in the Area
Average Home Value in this Area
Purchase History
| Date | Buyer | Sale Price | Title Company |
|---|---|---|---|
| Moura Susan M | -- | -- |
Source: Public Records
Mortgage History
| Date | Status | Borrower | Loan Amount |
|---|---|---|---|
| Open | Moura Susan M | $252,000 |
Source: Public Records
Tax History Compared to Growth
Tax History
| Year | Tax Paid | Tax Assessment Tax Assessment Total Assessment is a certain percentage of the fair market value that is determined by local assessors to be the total taxable value of land and additions on the property. | Land | Improvement |
|---|---|---|---|---|
| 2025 | $4,987 | $364,800 | $182,500 | $182,300 |
| 2024 | $4,953 | $357,900 | $175,500 | $182,400 |
| 2023 | $5,010 | $346,700 | $175,500 | $171,200 |
| 2022 | $4,883 | $313,000 | $159,600 | $153,400 |
| 2021 | $4,441 | $287,400 | $153,300 | $134,100 |
| 2020 | $4,364 | $276,700 | $147,500 | $129,200 |
| 2019 | $4,678 | $266,400 | $140,900 | $125,500 |
| 2018 | $4,562 | $254,000 | $140,900 | $113,100 |
| 2017 | $4,425 | $241,800 | $134,400 | $107,400 |
| 2016 | $4,353 | $239,700 | $134,400 | $105,300 |
| 2015 | $4,268 | $240,300 | $133,500 | $106,800 |
| 2014 | $4,155 | $239,200 | $130,700 | $108,500 |
Source: Public Records
Map
Nearby Homes
- 2 Magnolia Cir Unit 2
- 14 Mountain Ash Rd
- 936 Central St
- 11 Harmony Crossing
- 1 Simmons Place
- 585 N Bedford St
- 611 N Bedford St
- 844 Washington St
- 22 Water St
- 71 Church St
- 572 Harvard St
- 217 Crystal Water Dr
- 78 Crystal Water Dr
- 182 Crystal Water Dr Unit 182
- 848 N Bedford St
- 848 N Bedford St Phase IV
- 848 N
- 41 Bedford St
- 70 Surrey Ln
- 70 Surrey Ln