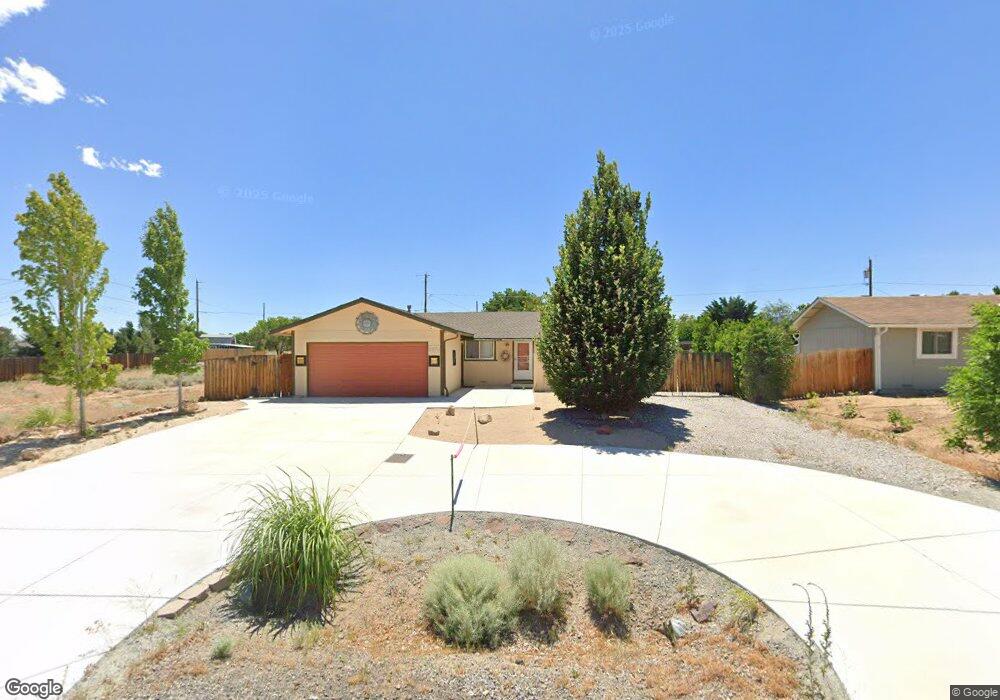
6670 David James Blvd Sparks, NV 89436
Eagle Canyon-Pebble Creek NeighborhoodEstimated Value: $357,000 - $424,000
2
Beds
1
Bath
960
Sq Ft
$412/Sq Ft
Est. Value
About This Home
This home is located at 6670 David James Blvd, Sparks, NV 89436 and is currently estimated at $395,585, approximately $412 per square foot. 6670 David James Blvd is a home located in Washoe County with nearby schools including Jesse Hall Elementery School, Yvonne Shaw Middle School, and Spanish Springs High School.
Ownership History
Date
Name
Owned For
Owner Type
Purchase Details
Closed on
Dec 14, 2015
Sold by
Borges Barbara
Bought by
Borges Barbara and The Barbara Borges Trust
Current Estimated Value
Purchase Details
Closed on
May 1, 2015
Sold by
Borges Barbara
Bought by
Borges Barbara
Purchase Details
Closed on
Jul 21, 2008
Sold by
Swenson Nena R and Mizener Matthew M
Bought by
Borges William A
Home Financials for this Owner
Home Financials are based on the most recent Mortgage that was taken out on this home.
Original Mortgage
$153,425
Interest Rate
6.41%
Mortgage Type
Unknown
Purchase Details
Closed on
Sep 4, 1998
Sold by
Orbock Edward J C and Orbock Connie A
Bought by
Mizener Matthew M and Swenson Nena R
Home Financials for this Owner
Home Financials are based on the most recent Mortgage that was taken out on this home.
Original Mortgage
$86,400
Interest Rate
8.75%
Create a Home Valuation Report for This Property
The Home Valuation Report is an in-depth analysis detailing your home's value as well as a comparison with similar homes in the area
Home Values in the Area
Average Home Value in this Area
Purchase History
| Date | Buyer | Sale Price | Title Company |
|---|---|---|---|
| Borges Barbara | -- | None Available | |
| Borges Barbara | -- | None Available | |
| Borges William A | -- | None Available | |
| Borges William A | $161,500 | Western Title Inc Ridge | |
| Mizener Matthew M | $108,000 | Western Title Company Inc |
Source: Public Records
Mortgage History
| Date | Status | Borrower | Loan Amount |
|---|---|---|---|
| Previous Owner | Borges William A | $153,425 | |
| Previous Owner | Mizener Matthew M | $86,400 | |
| Closed | Mizener Matthew M | $24,800 |
Source: Public Records
Tax History Compared to Growth
Tax History
| Year | Tax Paid | Tax Assessment Tax Assessment Total Assessment is a certain percentage of the fair market value that is determined by local assessors to be the total taxable value of land and additions on the property. | Land | Improvement |
|---|---|---|---|---|
| 2026 | -- | $57,403 | $33,880 | $23,523 |
| 2025 | $1,063 | $57,956 | $33,600 | $24,357 |
| 2024 | $1,063 | $56,995 | $31,815 | $25,180 |
| 2023 | $747 | $55,436 | $31,500 | $23,937 |
| 2022 | $1,002 | $45,599 | $25,375 | $20,224 |
| 2021 | $974 | $40,719 | $20,265 | $20,454 |
| 2020 | $854 | $35,827 | $18,200 | $17,627 |
| 2019 | $830 | $34,937 | $17,605 | $17,332 |
| 2018 | $807 | $30,226 | $12,985 | $17,241 |
| 2017 | $784 | $27,718 | $10,185 | $17,533 |
| 2016 | $762 | $28,556 | $10,290 | $18,266 |
| 2015 | $761 | $26,753 | $8,260 | $18,493 |
| 2014 | $739 | $24,921 | $6,860 | $18,061 |
| 2013 | -- | $22,020 | $3,885 | $18,135 |
Source: Public Records
Map
Nearby Homes
- 5680 Dolores Dr
- 50 N Spring Mountain Cir
- 3705 Erin Dr
- 7440 Ash Springs Dr
- 30 N Patterson Place
- Merino Elite Plan at Stonebrook - Cordoba
- Merino Plan at Stonebrook - Cordoba
- Clarita Plan at Stonebrook - Tavira
- Sabas Plan at Stonebrook - Tavira
- Leandro Plan at Stonebrook - Tavira
- Clemente Plan at Stonebrook - Cordoba
- 3630 Grove Springs Dr
- 7585 Ark Royal Way Unit Cordoba 35
- 7523 Nautilus Ct
- 1239 Lullabrooke Ct
- 1191 Hushfield Ct
- 198 Tankersley Dr
- 7366 Black Pearl Dr Unit Tavira 81
- 7366 Black Pearl Dr
- 1521 Evangeline Dr
- 6660 David James Blvd
- 52 S Amanda Cir
- 6650 David James Blvd
- 62 S Amanda Cir
- 17 S Tropicana Cir
- 27 S Tropicana Cir
- 6640 David James Blvd
- 37 S Tropicana Cir Unit 1
- 6685 David James Blvd
- 6655 David James Blvd Unit 1
- 32 S Amanda Cir
- 69 S Amanda Cir
- 6630 David James Blvd Unit 1
- 6645 David James Blvd
- 25 N Tropicana Cir
- 22 S Tropicana Cir
- 12 S Tropicana Cir
- 67 S Amanda Cir
- 6635 David James Blvd
- 22 S Amanda Cir