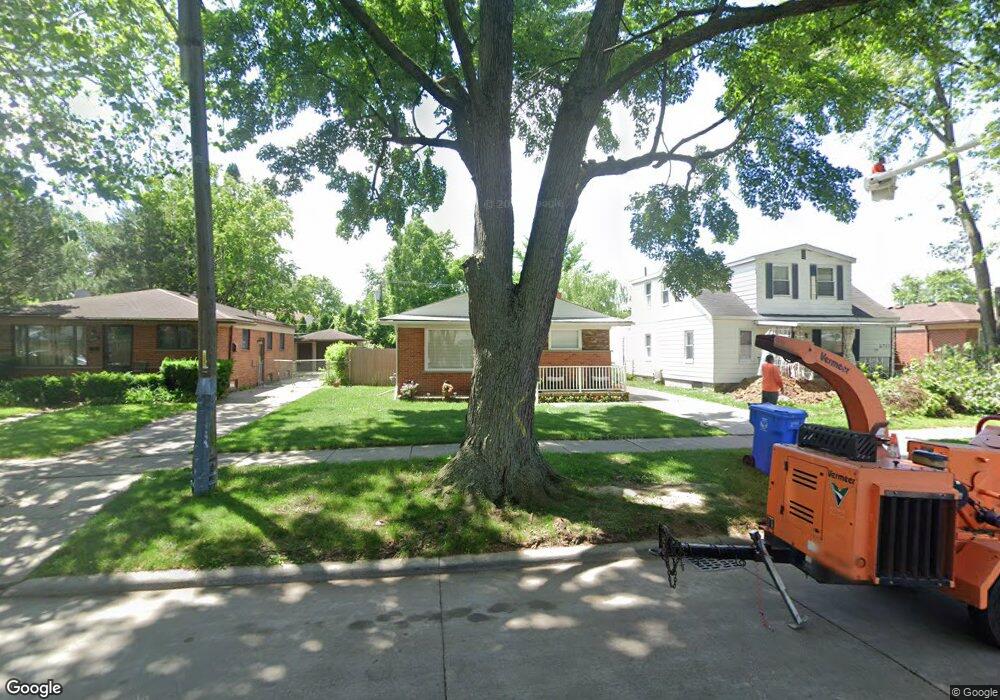
6671 Norborne Ave Unit Bldg-Unit Dearborn Heights, MI 48127
Estimated Value: $296,000 - $339,000
3
Beds
2
Baths
999
Sq Ft
$317/Sq Ft
Est. Value
About This Home
This home is located at 6671 Norborne Ave Unit Bldg-Unit, Dearborn Heights, MI 48127 and is currently estimated at $317,100, approximately $317 per square foot. 6671 Norborne Ave Unit Bldg-Unit is a home located in Wayne County with nearby schools including Crestwood High School, Riverside Middle School, and Kinloch Elementary School.
Ownership History
Date
Name
Owned For
Owner Type
Purchase Details
Closed on
Feb 5, 2024
Sold by
Zubaydiya Asraa and Obeidi Mahmoud
Bought by
Fakhruldin Maythem
Current Estimated Value
Purchase Details
Closed on
May 20, 2022
Sold by
Asraa Zubaydiya
Bought by
Zubaydiya Asraa and Obeidi Mahmoud
Home Financials for this Owner
Home Financials are based on the most recent Mortgage that was taken out on this home.
Original Mortgage
$131,000
Interest Rate
5.25%
Mortgage Type
New Conventional
Purchase Details
Closed on
Nov 27, 2019
Sold by
Mohammed Zaid Z and Zubaydiya Asraa
Bought by
Zubaydiya Asraa
Purchase Details
Closed on
Jan 18, 2018
Sold by
The Trochio Family Revocable Living Trus
Bought by
Mohammed Zaid
Purchase Details
Closed on
Jul 22, 2004
Sold by
Trochio William L and Trochio Georgia
Bought by
Trochio William L
Create a Home Valuation Report for This Property
The Home Valuation Report is an in-depth analysis detailing your home's value as well as a comparison with similar homes in the area
Home Values in the Area
Average Home Value in this Area
Purchase History
| Date | Buyer | Sale Price | Title Company |
|---|---|---|---|
| Fakhruldin Maythem | $285,000 | None Listed On Document | |
| Fakhruldin Maythem | $285,000 | None Listed On Document | |
| Zubaydiya Asraa | -- | None Listed On Document | |
| Zubaydiya Asraa | -- | None Available | |
| Mohammed Zaid | $120,000 | Minnesota Title Agency | |
| Trochio William L | -- | -- |
Source: Public Records
Mortgage History
| Date | Status | Borrower | Loan Amount |
|---|---|---|---|
| Previous Owner | Zubaydiya Asraa | $131,000 |
Source: Public Records
Tax History Compared to Growth
Tax History
| Year | Tax Paid | Tax Assessment Tax Assessment Total Assessment is a certain percentage of the fair market value that is determined by local assessors to be the total taxable value of land and additions on the property. | Land | Improvement |
|---|---|---|---|---|
| 2025 | $2,251 | $114,000 | $0 | $0 |
| 2024 | $2,251 | $91,900 | $0 | $0 |
| 2023 | $2,128 | $80,000 | $0 | $0 |
| 2022 | $2,881 | $70,600 | $0 | $0 |
| 2021 | $2,889 | $64,600 | $0 | $0 |
| 2019 | $2,812 | $55,300 | $0 | $0 |
| 2018 | $1,331 | $47,000 | $0 | $0 |
| 2017 | $1,108 | $46,100 | $0 | $0 |
| 2016 | $1,842 | $41,600 | $0 | $0 |
| 2015 | $3,582 | $39,000 | $0 | $0 |
| 2013 | $3,470 | $35,400 | $0 | $0 |
| 2010 | -- | $42,000 | $0 | $0 |
Source: Public Records
Map
Nearby Homes
- 6735 Norborne Ave
- 6453 Centralia St
- 6804 Centralia St
- 6435 Centralia St
- 6431 Centralia St
- 6429 N Beech Daly Rd
- 6905 N Beech Daly Rd
- 7139 Centralia St
- 26511 W Warren St
- 6129 Kinmore St
- 25542 W Warren St
- 7241 Lucerne St
- 6125 Ardmore
- 6701 Rosemary St
- 5955 N Beech Daly Rd
- 6426 Highview St
- 25427 Elon Dr
- 5947 Kinmore St
- 25470 Kennedy St
- 7875 Robindale Ave
- 6671 Norborne Ave
- 6661 Norborne Ave Unit Bldg-Unit
- 6661 Norborne Ave
- 6711 Norborne Ave
- 6719 Norborne Ave
- 6641 Norborne Ave
- 6729 Norborne Ave
- 6724 Berwyn St
- 6670 Berwyn St
- 6654 Berwyn St
- 6736 Berwyn St
- 6644 Berwyn St
- 6754 Berwyn St
- 6631 Norborne Ave
- 6670 Norborne Ave Unit Bldg-Unit
- 6670 Norborne Ave
- 6710 Norborne Ave
- 6660 Norborne Ave
- 6634 Berwyn St
- 6650 Norborne Ave