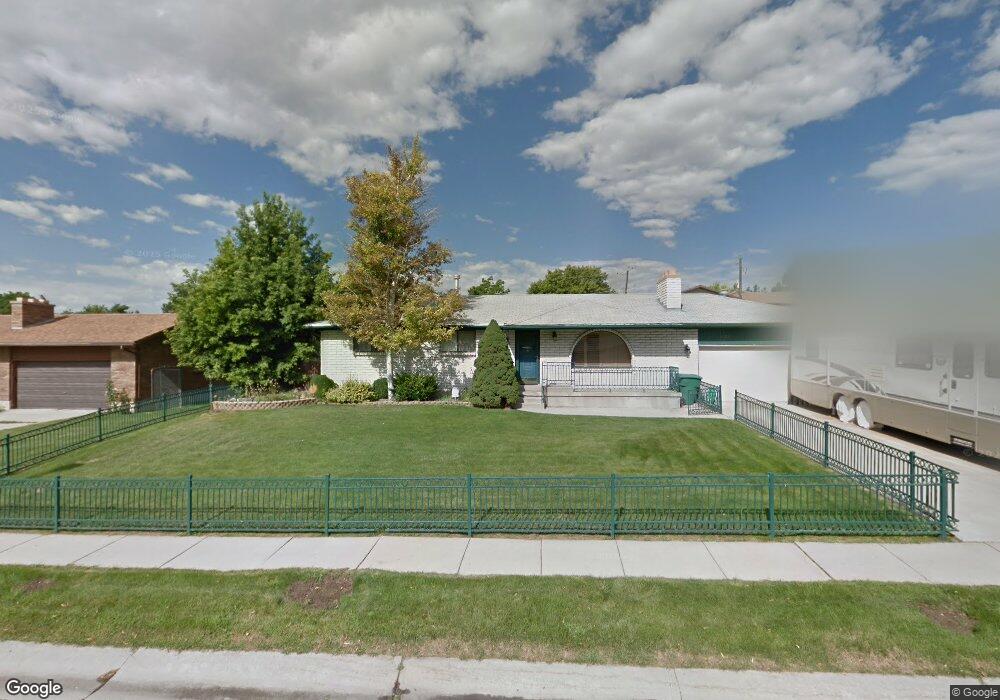
6672 Fargo Rd West Jordan, UT 84084
Estimated Value: $605,000 - $651,820
4
Beds
3
Baths
1,372
Sq Ft
$461/Sq Ft
Est. Value
About This Home
This home is located at 6672 Fargo Rd, West Jordan, UT 84084 and is currently estimated at $632,705, approximately $461 per square foot. 6672 Fargo Rd is a home located in Salt Lake County with nearby schools including West Jordan School, Majestic Elementary Arts Academy, and West Jordan Middle School.
Ownership History
Date
Name
Owned For
Owner Type
Purchase Details
Closed on
Apr 28, 2021
Sold by
Allen Mock Jeffrey
Bought by
Mock Jeffrey Allen and Mock Melissa
Current Estimated Value
Home Financials for this Owner
Home Financials are based on the most recent Mortgage that was taken out on this home.
Original Mortgage
$461,029
Outstanding Balance
$417,154
Interest Rate
3%
Mortgage Type
FHA
Estimated Equity
$215,551
Purchase Details
Closed on
Apr 26, 2021
Sold by
Mock Jeffrey Allen
Bought by
Mock Jeffrey Allen and Mock Melissa
Home Financials for this Owner
Home Financials are based on the most recent Mortgage that was taken out on this home.
Original Mortgage
$461,029
Outstanding Balance
$417,154
Interest Rate
3%
Mortgage Type
FHA
Estimated Equity
$215,551
Purchase Details
Closed on
May 2, 1997
Sold by
Barnes Dean R and Barnes Jennie L
Bought by
Barnes Dean Richard and Barnes Jennie Lynn
Create a Home Valuation Report for This Property
The Home Valuation Report is an in-depth analysis detailing your home's value as well as a comparison with similar homes in the area
Home Values in the Area
Average Home Value in this Area
Purchase History
| Date | Buyer | Sale Price | Title Company |
|---|---|---|---|
| Mock Jeffrey Allen | -- | Stewart Title | |
| Mock Jeffrey Allen | -- | Vanguard Title | |
| Mock Jeffrey Allen | -- | Stewart Title Ins Agcy Of Ut | |
| Mock Jeffrey Allen | -- | Vanguard Title | |
| Barnes Dean Richard | -- | -- |
Source: Public Records
Mortgage History
| Date | Status | Borrower | Loan Amount |
|---|---|---|---|
| Open | Mock Jeffrey Allen | $461,029 | |
| Closed | Mock Jeffrey Allen | $461,029 | |
| Closed | Mock Jeffrey Allen | $461,029 |
Source: Public Records
Tax History Compared to Growth
Tax History
| Year | Tax Paid | Tax Assessment Tax Assessment Total Assessment is a certain percentage of the fair market value that is determined by local assessors to be the total taxable value of land and additions on the property. | Land | Improvement |
|---|---|---|---|---|
| 2025 | $3,163 | $626,700 | $133,300 | $493,400 |
| 2024 | $3,163 | $608,500 | $128,800 | $479,700 |
| 2023 | $3,192 | $578,800 | $123,900 | $454,900 |
| 2022 | $3,333 | $594,600 | $121,400 | $473,200 |
| 2021 | $2,587 | $420,100 | $96,100 | $324,000 |
| 2020 | $2,407 | $366,900 | $89,800 | $277,100 |
| 2019 | $134 | $363,700 | $89,800 | $273,900 |
| 2018 | $121 | $318,800 | $84,800 | $234,000 |
| 2017 | $2,058 | $300,400 | $84,800 | $215,600 |
| 2016 | $2,058 | $285,300 | $84,800 | $200,500 |
| 2015 | $2,026 | $273,900 | $86,400 | $187,500 |
| 2014 | $1,917 | $255,200 | $82,400 | $172,800 |
Source: Public Records
Map
Nearby Homes
- 2333 W Ledgewood Dr
- 2683 W Carson Ln
- 2421 W 6900 S
- 2332 Broderick Dr
- 6924 S 2160 W
- 6918 S Harvest Cir
- 6925 S Lexington Dr
- 6683 Alice Susanna Ln
- 2126 W Happiness Dr
- 2312 W Hidden Bend Cove Unit 107
- 6512 Timpanogos Way
- 2045 W 6200 S
- 8524 S Michele River Ave W Unit 109
- 1951 W 7125 S
- 6453 Fremont Peak Cir
- 7150 Camelot Way
- 7149 S Camelot Way
- 3052 W Matterhorn Dr
- 2113 W Surrey Cir
- 6893 S 3200 W
- 6672 S Fargo Rd
- 6682 Fargo Rd
- 6662 Fargo Rd
- 6687 Carson Cir
- 6687 S Carson Cir
- 2437 Countryside Ln
- 6671 Fargo Rd
- 6681 Carson Cir
- 6692 Fargo Rd
- 6681 Fargo Rd
- 6661 S Fargo Rd
- 6661 Fargo Rd
- 2447 Countryside Ln
- 6691 Carson Cir
- 6691 S Carson Cir
- 6691 Fargo Rd
- 6691 S Fargo Rd
- 6702 Fargo Rd
- 6658 Nottingham Dr
- 6672 Nottingham Dr