Estimated Value: $193,728 - $210,000
3
Beds
1
Bath
1,026
Sq Ft
$199/Sq Ft
Est. Value
About This Home
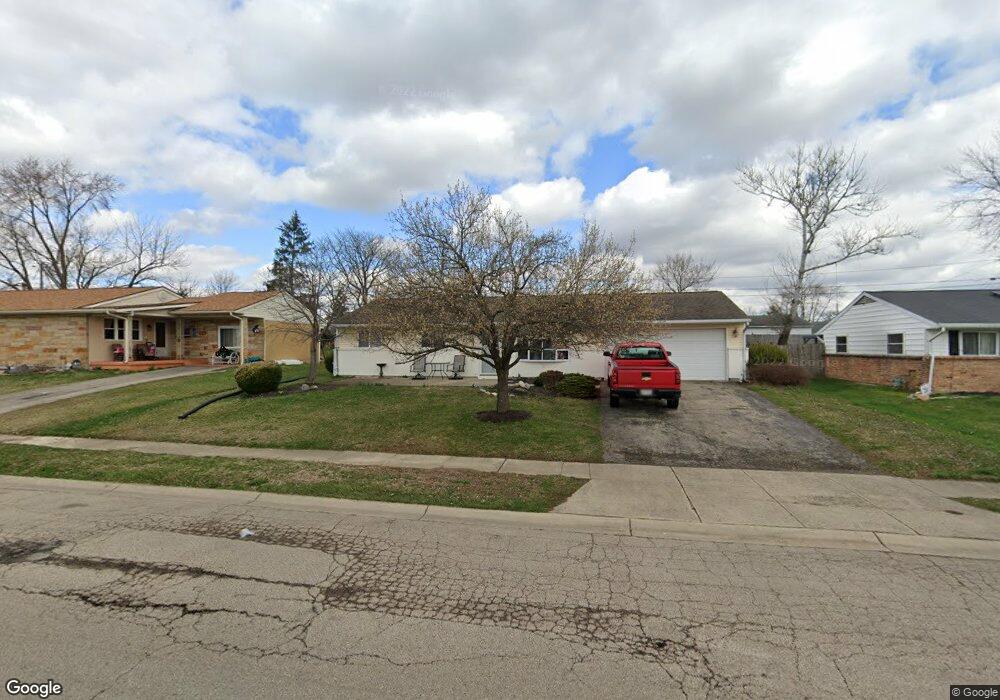
This home is located at 6672 Southern Vista Dr, Enon, OH 45323 and is currently estimated at $204,432, approximately $199 per square foot. 6672 Southern Vista Dr is a home located in Clark County with nearby schools including Greenon Elementary School, Greenon Jr. High School, and Greenon High School.
Ownership History
Date
Name
Owned For
Owner Type
Purchase Details
Closed on
Jun 15, 2020
Sold by
Fairow Mary B
Bought by
Wysong Steve
Current Estimated Value
Home Financials for this Owner
Home Financials are based on the most recent Mortgage that was taken out on this home.
Original Mortgage
$130,591
Outstanding Balance
$115,759
Interest Rate
3.2%
Mortgage Type
New Conventional
Estimated Equity
$88,673
Purchase Details
Closed on
Dec 17, 2008
Sold by
Judd Denise and Judd Stanton E
Bought by
Fairow Mary B
Home Financials for this Owner
Home Financials are based on the most recent Mortgage that was taken out on this home.
Original Mortgage
$89,514
Interest Rate
6.19%
Mortgage Type
FHA
Purchase Details
Closed on
Jan 20, 2005
Sold by
Carter Scott
Bought by
Carter Denise
Purchase Details
Closed on
Apr 15, 1991
Create a Home Valuation Report for This Property
The Home Valuation Report is an in-depth analysis detailing your home's value as well as a comparison with similar homes in the area
Home Values in the Area
Average Home Value in this Area
Purchase History
| Date | Buyer | Sale Price | Title Company |
|---|---|---|---|
| Wysong Steve | $133,000 | Chicago Title Company Llc | |
| Fairow Mary B | $90,000 | Ohio Real Estate Title | |
| Carter Denise | -- | -- | |
| -- | $61,000 | -- |
Source: Public Records
Mortgage History
| Date | Status | Borrower | Loan Amount |
|---|---|---|---|
| Open | Wysong Steve | $130,591 | |
| Previous Owner | Fairow Mary B | $89,514 |
Source: Public Records
Tax History Compared to Growth
Tax History
| Year | Tax Paid | Tax Assessment Tax Assessment Total Assessment is a certain percentage of the fair market value that is determined by local assessors to be the total taxable value of land and additions on the property. | Land | Improvement |
|---|---|---|---|---|
| 2024 | $2,196 | $41,570 | $9,710 | $31,860 |
| 2023 | $2,196 | $41,570 | $9,710 | $31,860 |
| 2022 | $2,194 | $41,570 | $9,710 | $31,860 |
| 2021 | $2,036 | $34,110 | $7,200 | $26,910 |
| 2020 | $1,524 | $34,110 | $7,200 | $26,910 |
| 2019 | $1,544 | $34,110 | $7,200 | $26,910 |
| 2018 | $1,373 | $31,100 | $7,850 | $23,250 |
| 2017 | $1,395 | $27,699 | $7,847 | $19,852 |
| 2016 | $1,219 | $27,699 | $7,847 | $19,852 |
| 2015 | $1,091 | $26,698 | $7,847 | $18,851 |
| 2014 | $1,077 | $26,698 | $7,847 | $18,851 |
| 2013 | $961 | $26,698 | $7,847 | $18,851 |
Source: Public Records
Map
Nearby Homes
- 6596 Oak Hill Dr
- 4441 S Xenia Dr
- 4538 Cynthia Dr
- 132 Green Vista Dr
- 6861 Joseph Dr
- 3729 Marion Dr
- 3644-3650 Charlotte Dr
- 3628-3642 Charlotte Dr
- 3611-3625 Charlotte Dr
- 111 Estelle Ave
- 2132 Willow Run Cir
- 806 Spring Lake Cir Unit 6
- 7581 Dayton Springfield Rd
- 5463 Enon-Xenia Rd
- 62 Fay Dr
- 4772 Pheasanthill Ct
- 7909 Court Ridge Ln
- 68 Skyline Dr
- 5540 Broadway Rd
- 4600 Snider Rd
- 6658 Southern Vista Dr
- 6684 Southern Vista Dr
- 6671 Ravenna Ave
- 6683 Ravenna Ave
- 6655 Ravenna Ave
- 6700 Southern Vista Dr
- 6642 Southern Vista Dr
- 6695 Ravenna Ave
- 6641 Ravenna Ave
- 6673 Southern Vista Dr
- 6661 Southern Vista Dr
- 6691 Southern Vista Dr
- 6624 Southern Vista Dr
- 6714 Southern Vista Dr
- 6651 Southern Vista Dr
- 6711 Ravenna Ave
- 6625 Ravenna Ave
- 6699 Southern Vista Dr
- 6688 Ravenna Ave
- 6635 Southern Vista Dr