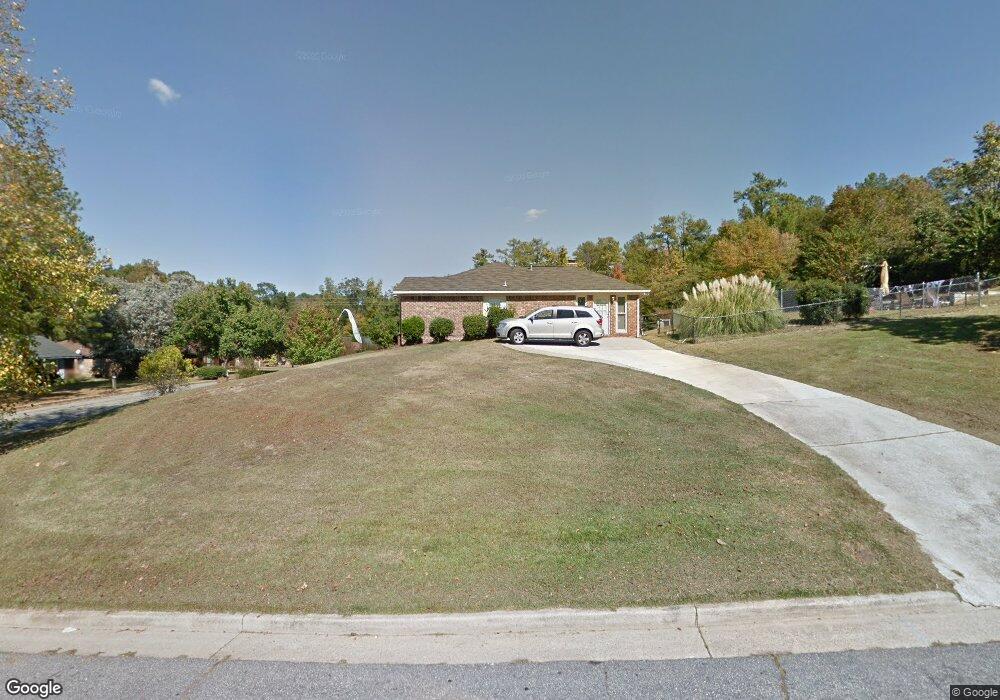
6676 Lemans Ln Columbus, GA 31909
North Columbus NeighborhoodEstimated Value: $209,000 - $243,000
3
Beds
3
Baths
1,528
Sq Ft
$149/Sq Ft
Est. Value
About This Home
This home is located at 6676 Lemans Ln, Columbus, GA 31909 and is currently estimated at $228,323, approximately $149 per square foot. 6676 Lemans Ln is a home located in Muscogee County with nearby schools including Eagle Ridge Academy, Blackmon Road Middle School, and Shaw High School.
Ownership History
Date
Name
Owned For
Owner Type
Purchase Details
Closed on
Feb 19, 2015
Sold by
Little Peggy A
Bought by
Henderson Sonya
Current Estimated Value
Home Financials for this Owner
Home Financials are based on the most recent Mortgage that was taken out on this home.
Original Mortgage
$154,646
Outstanding Balance
$116,719
Interest Rate
3.37%
Mortgage Type
FHA
Estimated Equity
$111,604
Purchase Details
Closed on
Sep 12, 2011
Sold by
Rutland Jerry P
Bought by
Little Peggy A
Home Financials for this Owner
Home Financials are based on the most recent Mortgage that was taken out on this home.
Original Mortgage
$141,324
Interest Rate
4.22%
Mortgage Type
FHA
Purchase Details
Closed on
Oct 31, 2007
Sold by
Peirce Richard S and Peirce Teresa M
Bought by
Rutland Jerry P and Rutland Glenn S
Home Financials for this Owner
Home Financials are based on the most recent Mortgage that was taken out on this home.
Original Mortgage
$123,750
Interest Rate
6.27%
Mortgage Type
Purchase Money Mortgage
Create a Home Valuation Report for This Property
The Home Valuation Report is an in-depth analysis detailing your home's value as well as a comparison with similar homes in the area
Home Values in the Area
Average Home Value in this Area
Purchase History
| Date | Buyer | Sale Price | Title Company |
|---|---|---|---|
| Henderson Sonya | $157,500 | -- | |
| Little Peggy A | $145,000 | -- | |
| Rutland Jerry P | $165,000 | None Available |
Source: Public Records
Mortgage History
| Date | Status | Borrower | Loan Amount |
|---|---|---|---|
| Open | Henderson Sonya | $154,646 | |
| Previous Owner | Little Peggy A | $141,324 | |
| Previous Owner | Rutland Jerry P | $123,750 |
Source: Public Records
Tax History
| Year | Tax Paid | Tax Assessment Tax Assessment Total Assessment is a certain percentage of the fair market value that is determined by local assessors to be the total taxable value of land and additions on the property. | Land | Improvement |
|---|---|---|---|---|
| 2025 | $1,808 | $67,540 | $10,952 | $56,588 |
| 2024 | $1,807 | $67,540 | $10,952 | $56,588 |
| 2023 | $1,124 | $67,540 | $10,952 | $56,588 |
| 2022 | $1,884 | $54,604 | $10,952 | $43,652 |
| 2021 | $1,877 | $62,240 | $10,952 | $51,288 |
| 2020 | $1,878 | $62,240 | $10,952 | $51,288 |
| 2019 | $1,885 | $62,240 | $10,952 | $51,288 |
| 2018 | $1,885 | $62,240 | $10,952 | $51,288 |
| 2017 | $1,893 | $62,240 | $10,952 | $51,288 |
| 2016 | $1,901 | $59,364 | $9,370 | $49,994 |
| 2015 | $1,887 | $59,364 | $9,370 | $49,994 |
| 2014 | $1,890 | $59,364 | $9,370 | $49,994 |
| 2013 | -- | $58,425 | $9,370 | $49,055 |
Source: Public Records
Map
Nearby Homes
- 4618 Thoroughbred Ln
- 4543 Papaya Dr
- 4826 Teak Dr
- 4802 Basswood Dr
- 5041 Montego Dr
- 4449 Miller
- 6421 Lemans Ln
- 4627 Wimbish Ct
- 6629 Benson Dr
- 5042 Foxfire Dr
- 4507 N Oaks Dr
- 5045 Old Post Rd
- 4603 Mayo Dr
- 6528 Yellow Stone Ct
- 4465 Weems Rd
- 6502 Tidewater Ct
- 1 N Whisper Ct
- 7811 Eagles Landing Ct
- 8091 Turtle Creek Dr
- 4730 Turnberry Ln Unit 15
Your Personal Tour Guide
Ask me questions while you tour the home.