Estimated Value: $220,441 - $241,000
3
Beds
2
Baths
1,360
Sq Ft
$169/Sq Ft
Est. Value
About This Home
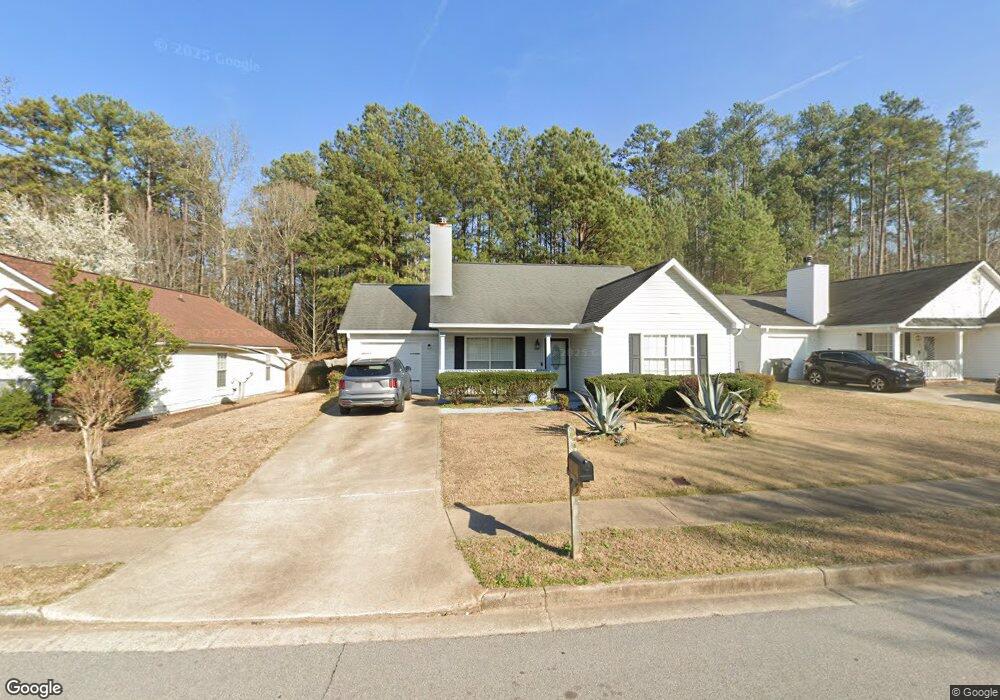
This home is located at 6676 Saganaw Dr Unit 1/25, Rex, GA 30273 and is currently estimated at $230,360, approximately $169 per square foot. 6676 Saganaw Dr Unit 1/25 is a home located in Clayton County with nearby schools including Roberta T. Smith Elementary School, Rex Mill Middle School, and Mount Zion High School.
Ownership History
Date
Name
Owned For
Owner Type
Purchase Details
Closed on
May 22, 2018
Sold by
Hebert Edward
Bought by
Roussaw Terrance
Current Estimated Value
Home Financials for this Owner
Home Financials are based on the most recent Mortgage that was taken out on this home.
Original Mortgage
$124,160
Outstanding Balance
$107,151
Interest Rate
4.5%
Mortgage Type
New Conventional
Estimated Equity
$123,209
Purchase Details
Closed on
Apr 21, 2011
Sold by
Hollon Tammy
Bought by
Hebert Edward
Home Financials for this Owner
Home Financials are based on the most recent Mortgage that was taken out on this home.
Original Mortgage
$47,343
Interest Rate
4.37%
Mortgage Type
FHA
Purchase Details
Closed on
Dec 11, 1998
Sold by
Knight Group
Bought by
Hollon Tommu
Home Financials for this Owner
Home Financials are based on the most recent Mortgage that was taken out on this home.
Original Mortgage
$88,050
Interest Rate
6.87%
Mortgage Type
FHA
Create a Home Valuation Report for This Property
The Home Valuation Report is an in-depth analysis detailing your home's value as well as a comparison with similar homes in the area
Home Values in the Area
Average Home Value in this Area
Purchase History
| Date | Buyer | Sale Price | Title Company |
|---|---|---|---|
| Roussaw Terrance | $128,000 | -- | |
| Hebert Edward | $50,000 | -- | |
| Hollon Tommu | $89,900 | -- |
Source: Public Records
Mortgage History
| Date | Status | Borrower | Loan Amount |
|---|---|---|---|
| Open | Roussaw Terrance | $124,160 | |
| Previous Owner | Hebert Edward | $47,343 | |
| Previous Owner | Hollon Tommu | $88,050 |
Source: Public Records
Tax History Compared to Growth
Tax History
| Year | Tax Paid | Tax Assessment Tax Assessment Total Assessment is a certain percentage of the fair market value that is determined by local assessors to be the total taxable value of land and additions on the property. | Land | Improvement |
|---|---|---|---|---|
| 2024 | $2,738 | $79,200 | $7,128 | $72,072 |
| 2023 | $2,860 | $79,200 | $7,128 | $72,072 |
| 2022 | $1,702 | $52,400 | $8,908 | $43,492 |
| 2021 | $1,713 | $52,400 | $8,908 | $43,492 |
| 2020 | $1,419 | $52,400 | $8,800 | $43,600 |
| 2019 | $1,541 | $47,032 | $6,400 | $40,632 |
| 2018 | $1,072 | $35,460 | $6,400 | $29,060 |
| 2017 | $824 | $29,309 | $6,400 | $22,909 |
| 2016 | $649 | $25,011 | $6,400 | $18,611 |
| 2015 | $864 | $0 | $0 | $0 |
| 2014 | $592 | $23,902 | $6,400 | $17,502 |
Source: Public Records
Map
Nearby Homes
- 6614 Biscayne Blvd
- 6603 Biscayne Blvd
- 3700 Hudson Ct
- 6716 Teresa Ln
- 0 Lakeland Rd Unit 7648836
- 0 Lakeland Rd Unit 10603417
- 7027 Biscayne Blvd
- 3832 Augustine Place
- 3535 Henley St
- 6503 Old MacOn Hwy
- 6495 Old MacOn Hwy
- 6646 Creek Turn Dr
- 6968 New Dale Rd
- 6891 Dresden Dr
- 6870 Diamond Dr
- 3374 Creekwood Dr
- 6367 Ellenwood Dr
- 6676 Saganaw Dr
- 6670 Saganaw Dr Unit 1
- 6688 Saganaw Dr Unit 2
- 0 Saganaw Dr Unit 8695930
- 0 Saganaw Dr Unit 8680897
- 0 Saganaw Dr Unit 8647140
- 0 Saganaw Dr Unit 8232427
- 0 Saganaw Dr Unit 7570692
- 0 Saganaw Dr Unit 7348175
- 0 Saganaw Dr Unit 7169517
- 0 Saganaw Dr Unit 8832377
- 0 Saganaw Dr Unit 7543507
- 0 Saganaw Dr Unit 7407172
- 0 Saganaw Dr Unit 7171807
- 0 Saganaw Dr Unit 7136882
- 0 Saganaw Dr Unit 8956528
- 0 Saganaw Dr Unit 3274509
- 0 Saganaw Dr Unit 3283719
- 0 Saganaw Dr Unit 7080608
- 0 Saganaw Dr Unit 7131826