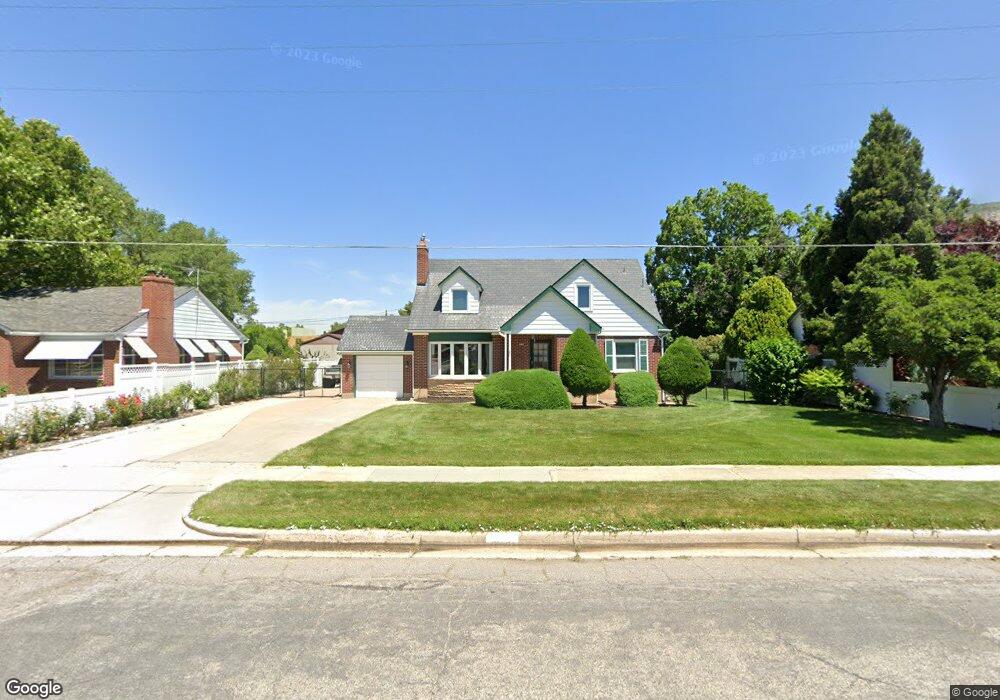
668 13th St Ogden, UT 84404
Canyon Road NeighborhoodEstimated Value: $418,000 - $506,000
4
Beds
2
Baths
2,746
Sq Ft
$170/Sq Ft
Est. Value
About This Home
This home is located at 668 13th St, Ogden, UT 84404 and is currently estimated at $468,071, approximately $170 per square foot. 668 13th St is a home located in Weber County with nearby schools including New Bridge School, Mound Fort Junior High School, and Ben Lomond High School.
Ownership History
Date
Name
Owned For
Owner Type
Purchase Details
Closed on
May 25, 2022
Sold by
Anthony Duran
Bought by
Mondragon Anthony
Current Estimated Value
Purchase Details
Closed on
Jan 6, 2017
Sold by
Duran Teri and Truett Teri
Bought by
Duran Anthony
Purchase Details
Closed on
Jun 27, 2014
Sold by
Duran Anthony and Truett Teri L
Bought by
Duran Anthony and Duran Teri
Home Financials for this Owner
Home Financials are based on the most recent Mortgage that was taken out on this home.
Original Mortgage
$176,000
Interest Rate
4.17%
Mortgage Type
New Conventional
Purchase Details
Closed on
May 9, 2007
Sold by
Duran Anthony
Bought by
Duran Anthony and Truett Teri L
Purchase Details
Closed on
Nov 7, 1996
Sold by
Read Boyd A and Read Ruth V
Bought by
Read Boyd A and Read Ruth
Create a Home Valuation Report for This Property
The Home Valuation Report is an in-depth analysis detailing your home's value as well as a comparison with similar homes in the area
Home Values in the Area
Average Home Value in this Area
Purchase History
| Date | Buyer | Sale Price | Title Company |
|---|---|---|---|
| Mondragon Anthony | -- | None Listed On Document | |
| Duran Anthony | -- | None Available | |
| Duran Anthony | -- | Backman Title Services Ltd | |
| Duran Anthony | -- | Equity Title Ogden | |
| Duran Anthony | -- | Premier | |
| Read Boyd A | -- | -- | |
| Read Boyd A | -- | -- |
Source: Public Records
Mortgage History
| Date | Status | Borrower | Loan Amount |
|---|---|---|---|
| Previous Owner | Duran Anthony | $176,000 |
Source: Public Records
Tax History
| Year | Tax Paid | Tax Assessment Tax Assessment Total Assessment is a certain percentage of the fair market value that is determined by local assessors to be the total taxable value of land and additions on the property. | Land | Improvement |
|---|---|---|---|---|
| 2025 | $3,031 | $444,291 | $129,927 | $314,364 |
| 2024 | $2,952 | $233,748 | $71,479 | $162,269 |
| 2023 | $2,744 | $218,643 | $61,779 | $156,864 |
| 2022 | $2,765 | $220,926 | $56,119 | $164,807 |
| 2021 | $2,602 | $344,998 | $61,325 | $283,673 |
| 2020 | $2,629 | $321,998 | $48,401 | $273,597 |
| 2019 | $2,747 | $315,948 | $45,483 | $270,465 |
| 2018 | $2,460 | $281,113 | $45,483 | $235,630 |
| 2017 | $2,145 | $228,915 | $35,865 | $193,050 |
| 2016 | $2,097 | $131,253 | $19,345 | $111,908 |
| 2015 | $1,871 | $105,349 | $19,345 | $86,004 |
| 2014 | $1,626 | $89,880 | $19,345 | $70,535 |
Source: Public Records
Map
Nearby Homes
- 1324 Liberty Ave
- 1110 Jefferson Ave
- 1424 Jefferson Ave
- 1116 Liberty Ave
- 1413 S Jefferson Ave
- 1107 Jefferson Ave
- 1502 Liberty Ave
- 793 E 1500 St S
- 506 14th St
- 968 S Jefferson Ave
- 1529 Jefferson Ave
- 935 E 1250 S
- 486 15th St
- 802 Canyon Rd
- 876 E 1025 S Unit 49
- 1266 S 950 E
- 443 E 1415 S Unit 118
- 718 9th St
- 439 E 1415 S Unit 117
- 433 E 1415 S Unit 116
Your Personal Tour Guide
Ask me questions while you tour the home.