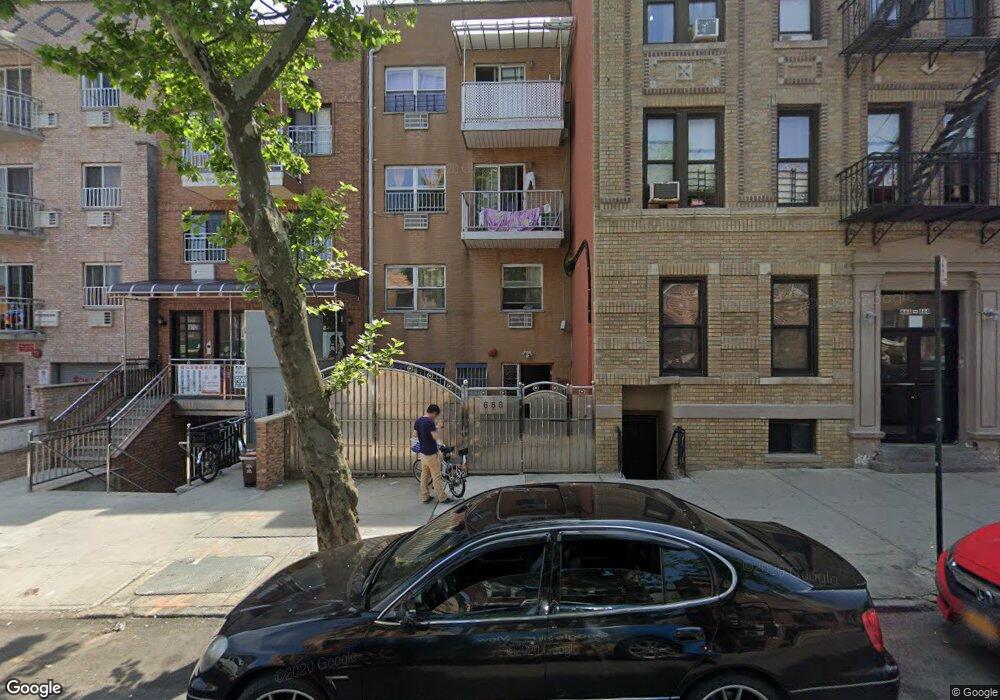
668 56th St Unit 2A Brooklyn, NY 11220
Sunset Park NeighborhoodEstimated Value: $632,000 - $848,000
Studio
--
Bath
959
Sq Ft
$795/Sq Ft
Est. Value
About This Home
This home is located at 668 56th St Unit 2A, Brooklyn, NY 11220 and is currently estimated at $762,525, approximately $795 per square foot. 668 56th St Unit 2A is a home located in Kings County with nearby schools including P.S. 105 The Blythebourne, IS 220 John J. Pershing, and Fort Hamilton High School.
Ownership History
Date
Name
Owned For
Owner Type
Purchase Details
Closed on
Jan 3, 2014
Sold by
New Wah Zen Llc
Bought by
Chen Yanchun and Yang Zhenxun
Current Estimated Value
Home Financials for this Owner
Home Financials are based on the most recent Mortgage that was taken out on this home.
Original Mortgage
$320,000
Outstanding Balance
$242,138
Interest Rate
4.45%
Mortgage Type
New Conventional
Estimated Equity
$520,387
Create a Home Valuation Report for This Property
The Home Valuation Report is an in-depth analysis detailing your home's value as well as a comparison with similar homes in the area
Home Values in the Area
Average Home Value in this Area
Purchase History
| Date | Buyer | Sale Price | Title Company |
|---|---|---|---|
| Chen Yanchun | $468,975 | -- |
Source: Public Records
Mortgage History
| Date | Status | Borrower | Loan Amount |
|---|---|---|---|
| Open | Chen Yanchun | $320,000 |
Source: Public Records
Tax History
| Year | Tax Paid | Tax Assessment Tax Assessment Total Assessment is a certain percentage of the fair market value that is determined by local assessors to be the total taxable value of land and additions on the property. | Land | Improvement |
|---|---|---|---|---|
| 2025 | $370 | $118,735 | $1,519 | $117,216 |
| 2024 | $370 | $106,347 | $1,519 | $104,828 |
| 2023 | $370 | $124,812 | $1,519 | $123,293 |
| 2022 | $361 | $122,591 | $1,519 | $121,072 |
| 2021 | $357 | $106,113 | $1,519 | $104,594 |
| 2020 | $366 | $116,047 | $1,519 | $114,528 |
| 2019 | $370 | $120,488 | $1,519 | $118,969 |
| 2018 | $377 | $82,039 | $1,128 | $80,911 |
| 2017 | $377 | $77,697 | $1,242 | $76,455 |
| 2016 | $382 | $71,942 | $1,367 | $70,575 |
| 2015 | $298 | $66,613 | $1,519 | $65,094 |
| 2014 | $298 | $64,860 | $1,519 | $63,341 |
Source: Public Records
Map
Nearby Homes
Your Personal Tour Guide
Ask me questions while you tour the home.