Estimated Value: $502,000 - $594,000
3
Beds
3
Baths
3,273
Sq Ft
$167/Sq Ft
Est. Value
About This Home
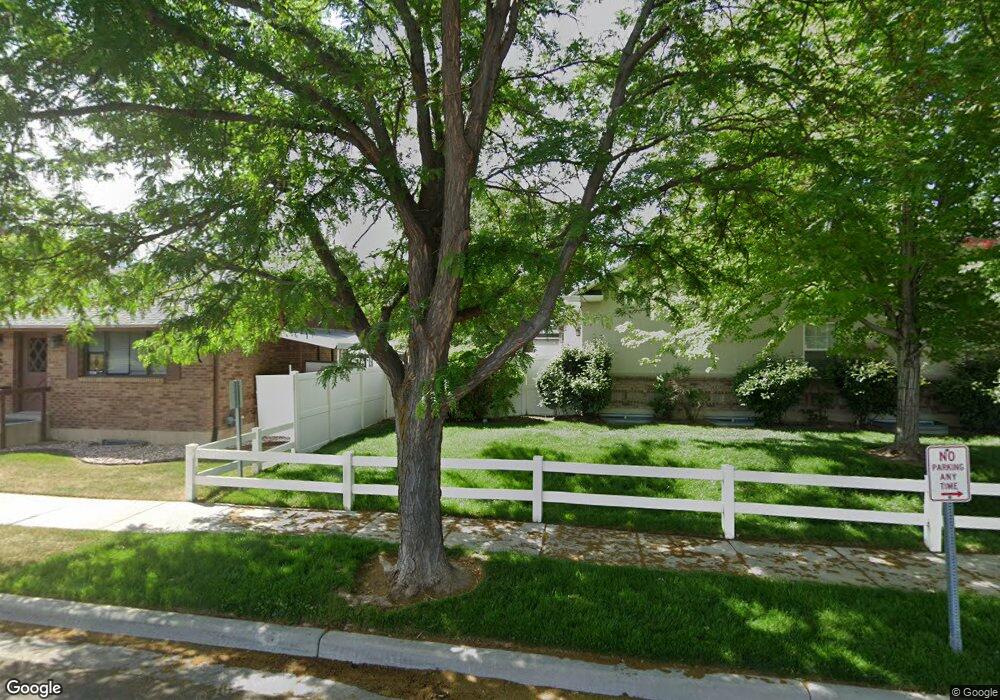
This home is located at 668 E Stonefly Dr, Sandy, UT 84070 and is currently estimated at $547,304, approximately $167 per square foot. 668 E Stonefly Dr is a home located in Salt Lake County with nearby schools including Sandy Elementary School, Mount Jordan Middle School, and Jordan High.
Ownership History
Date
Name
Owned For
Owner Type
Purchase Details
Closed on
Aug 30, 2010
Sold by
Hinckle James C and Hinckle Julie L
Bought by
Symes Scott B and Symes Joan G
Current Estimated Value
Home Financials for this Owner
Home Financials are based on the most recent Mortgage that was taken out on this home.
Original Mortgage
$208,800
Outstanding Balance
$138,157
Interest Rate
4.48%
Mortgage Type
New Conventional
Estimated Equity
$409,147
Purchase Details
Closed on
Dec 23, 2004
Sold by
Hinckle James C and Hinckle Julie L
Bought by
Hinckle James C and Hinckle Julie L
Purchase Details
Closed on
Aug 2, 2004
Sold by
Stevens Shonnie R
Bought by
Hinckle James C and Hinckle Julie L
Home Financials for this Owner
Home Financials are based on the most recent Mortgage that was taken out on this home.
Original Mortgage
$178,400
Interest Rate
6.29%
Mortgage Type
Credit Line Revolving
Purchase Details
Closed on
Dec 4, 1998
Sold by
Ms Sandy Associates Lc
Bought by
Stevens David C and Stevens Shonnie R
Home Financials for this Owner
Home Financials are based on the most recent Mortgage that was taken out on this home.
Original Mortgage
$110,000
Interest Rate
6.69%
Create a Home Valuation Report for This Property
The Home Valuation Report is an in-depth analysis detailing your home's value as well as a comparison with similar homes in the area
Home Values in the Area
Average Home Value in this Area
Purchase History
| Date | Buyer | Sale Price | Title Company |
|---|---|---|---|
| Symes Scott B | -- | Integrated Title Ins Svcs | |
| Hinckle James C | -- | -- | |
| Hinckle James C | -- | Integrated Title Ins Svcs | |
| Stevens David C | -- | Founders Title |
Source: Public Records
Mortgage History
| Date | Status | Borrower | Loan Amount |
|---|---|---|---|
| Open | Symes Scott B | $208,800 | |
| Previous Owner | Hinckle James C | $178,400 | |
| Previous Owner | Stevens David C | $110,000 |
Source: Public Records
Tax History
| Year | Tax Paid | Tax Assessment Tax Assessment Total Assessment is a certain percentage of the fair market value that is determined by local assessors to be the total taxable value of land and additions on the property. | Land | Improvement |
|---|---|---|---|---|
| 2025 | $3,045 | $507,200 | $152,100 | $355,100 |
| 2024 | $3,045 | $563,100 | $168,900 | $394,200 |
| 2023 | $3,148 | $580,500 | $174,100 | $406,400 |
| 2022 | $2,955 | $532,300 | $159,700 | $372,600 |
| 2021 | $2,485 | $381,100 | $114,300 | $266,800 |
| 2020 | $2,680 | $387,500 | $116,200 | $271,300 |
| 2019 | $2,321 | $327,100 | $98,100 | $229,000 |
| 2016 | $2,181 | $295,500 | $88,600 | $206,900 |
Source: Public Records
Map
Nearby Homes
- 635 Pioneer Ave
- 744 E 8425 S
- 8390 S 745 E
- 8322 S Levine Ln Unit 111
- 627 E 8680 S
- 8729 S Leafwood Ln
- 8732 S 620 E
- 8722 S Oakwood Park Cir
- 8268 S 865 E
- 8732 S Oakwood Park Cr
- 8797 Green Way Unit 3
- 359 E 8400 S
- 608 E 8800 S
- 8459 S 300 E
- 760 E 8080 S
- 8087 S 615 E
- 412 E 8760 S
- 991 Merewood Ct
- 8915 S 660 E Unit 103
- 8023 S Pinewood Dr
- 668 Stonefly Dr
- 672 Stonefly Dr Unit 9
- 672 E Stonefly Dr Unit 9
- 672 E Stonefly Dr
- 614 Stonefly Dr
- 656 E Stonefly Dr
- 656 Stonefly Dr
- 676 Stonefly Dr
- 680 Stonefly Dr
- 680 Stonefly Dr Unit 7
- 652 Stonefly Dr
- 652 Stonefly Dr Unit 12
- 8476 S 700 E
- 659 E Stonefly Dr Unit 38
- 659 E Stonefly Dr
- 659 Stonefly Dr
- 659 Stonefly Dr Unit 38
- 655 E Stonefly Dr Unit 37
- 655 Stonefly Dr
- 8451 Mayfly Way Unit 6
Your Personal Tour Guide
Ask me questions while you tour the home.